


2. Introduction
WNV has been spreading through the United States since 1999 and has proven to possess complicated disease dynamics (Hartley et al., 2012, Introduction Section; Sejvar, 2003, Abstract Section). The disease interacts with both natural hosts (birds and mosquitoes) and dead-end hosts (humans and horses). Natural hosts can infect each other, and some natural hosts can infect dead-end hosts as well. Contrastingly, dead-end hosts are not contagious when infected and end the transmission cycle (Colpitts et al., 2012, Vector-Virus Relationship Section). For instance, since birds and mosquitoes are natural hosts, they can infect each other with WNV, and mosquitoes can also infect horses and humans (Ahlers & Goodman, 2018, Abstract Section). However, horses and humans do not infect each other or mosquitoes because they are dead-end hosts. While many species can contract WNV, they are each affected differently (Wonham, n.d., para. 4). Humans generally make a full recovery within two weeks, but depending on the severity, they can take several weeks to recover (Staff, 2019, para. 3). Horses have a much harder time recovering and will relapse in some instances (Swinker, 2019, Treatment Section); however, they are also the only current species to have an effective vaccine for the disease (Swinker, 2019, Prevention Section). For a closer examination of the vaccination effects, refer to Sections 4 and 5 of this paper. We will discuss the intricacies of these differing disease dynamics in Section 3.1.
We used the NetLogo platform for agent-based modeling to create our model because it allows the user to assign specific characteristics to the agents or individuals in the model, allowing them to customize the agents into breeds and set specific parameters for each one. Our agents include humans, horses, mosquitoes, birds, and public health agents. NetLogo was also a convenient interface because it has various functionalities built into it, such as an interactive graphic display, a system for individualizing parameters, and a behavior space to retrieve data. All these features make NetLogo an effective modeling tool for our purposes.
Our model has two model-versions: “WNV,” where the focus is seeing the effect of vaccinations in horses, and “WNV-PHAs,” in which we monitored the contributions of the Public Health Agents within the disease dynamics. The only sizable difference between the two model versions is the addition of Public Health Agents or “PHAs.” The split of model versions allows us to compare the results from the two models to see how our data is altered under test conditions (see Section 5).
Our model has numerous compartments; though this increases its complexity, it also ensures a level of authenticity emulating that of the real world. The realistic world has a never-ending supply of variety that impacts all its interactions. While some of these interactions have been studied and have known quantities or averages, it is crucial to include factors of randomness in a model to account for variability within real-life scenarios.
For example, not all humans recover in an unvarying, set time. Since recovery is such a complex process that relies on various factors, individuals can recover in a variable amount of time depending on their unique genetics, environment, and lifestyle. If we are informed, we can make these connections and see causations, we are often not privy to these details though, as is the case in this model. Therefore, we perceive some events as random. For these reasons, we did not integrate specific factors related to recovery into our model. Instead, the goal has been to keep a level of randomness and variety that would reflect reality. In Section 3, we explain how we used recovery and other random values in our model, and in Section 4, we show how our values were validated.
Through these approaches, our model simulations give better predictions of what could happen under the specified conditions given by the observer. The observer can then evaluate the simulation results and measure the impact of certain factors, like the efforts of health agents or the use of vaccines. In this way, our model gathers data and examines how the disease dynamics are affected under various scenarios.
3. Agent-Based Model
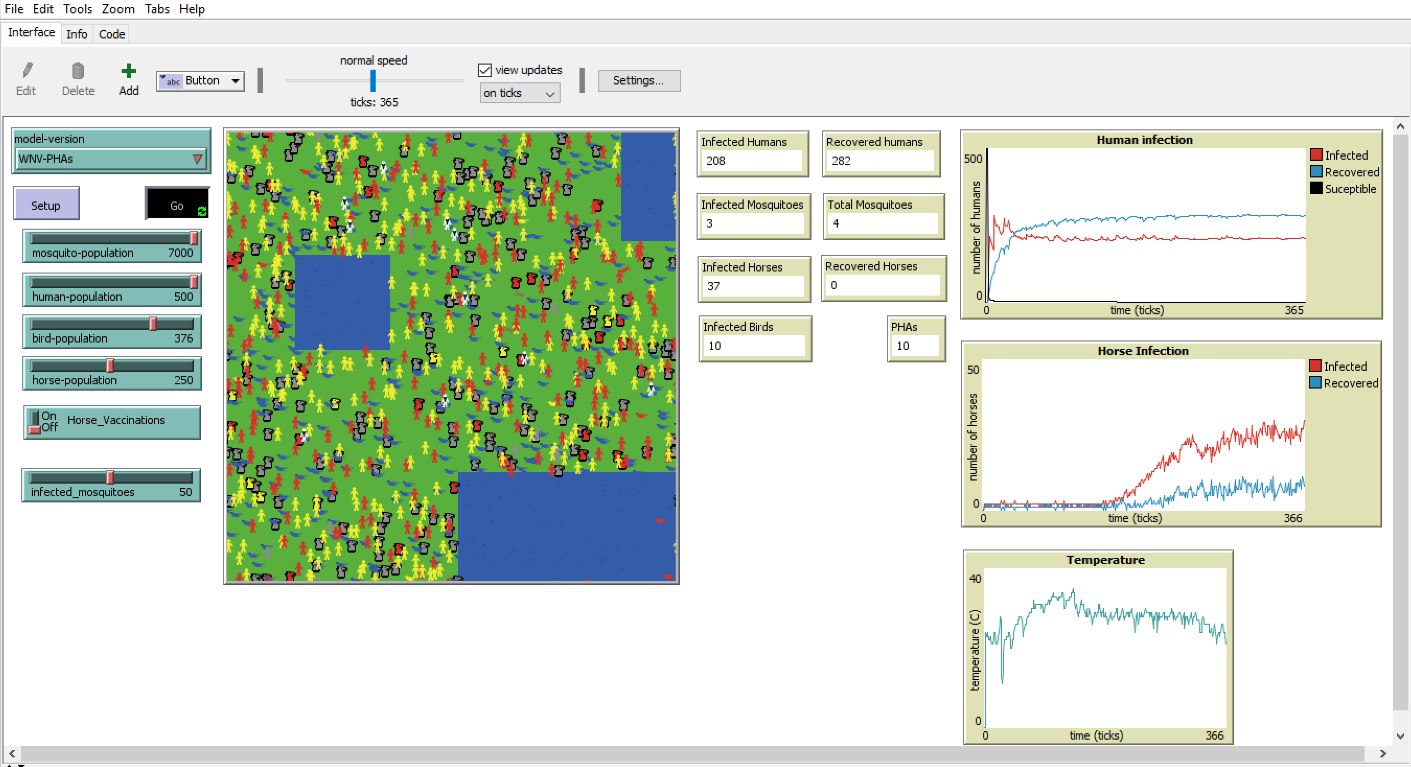
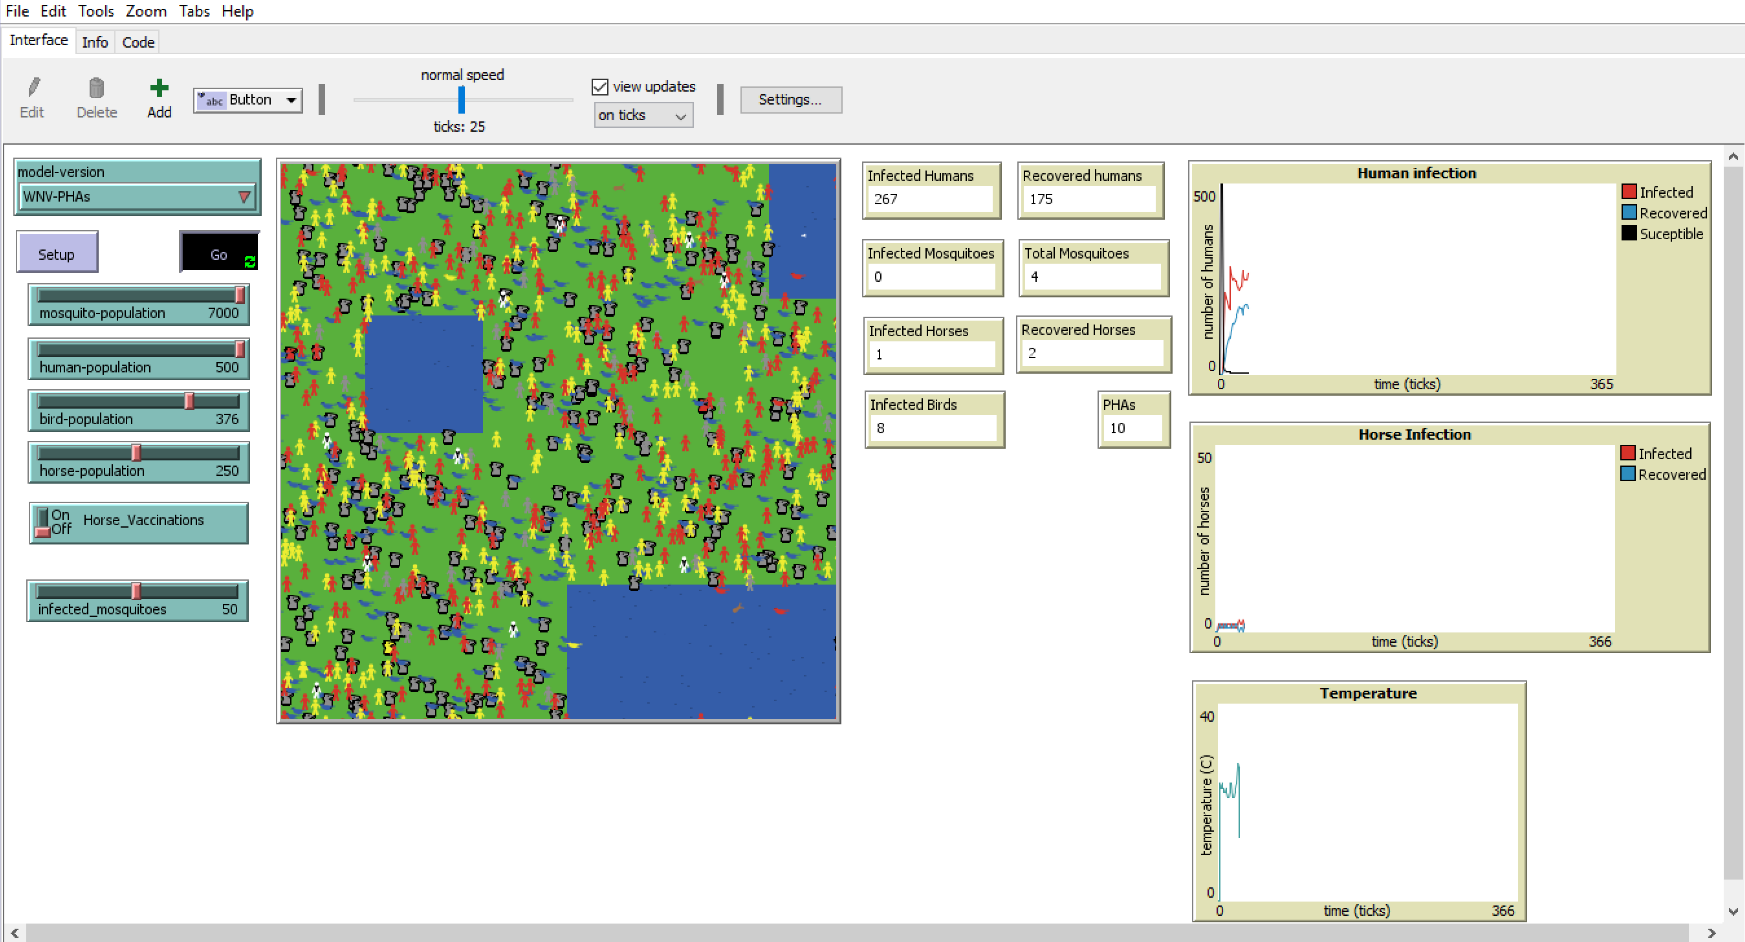
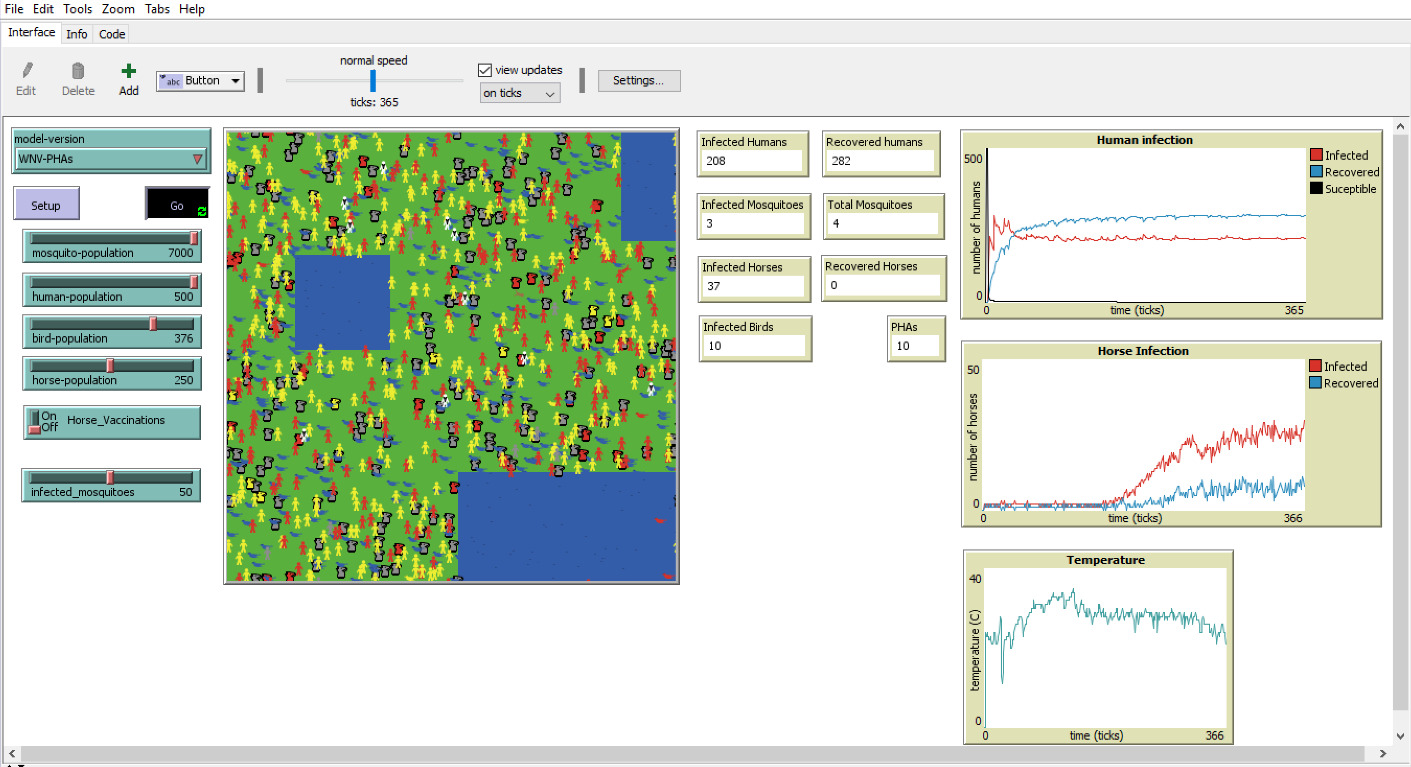
Agent-Based Modeling, or Individual-Based Modeling, is a subset of modeling that allows us to attribute specific characteristics and rules to individuals (agents) (Clinton-Selin, 1970, para. 4). Traditional mathematical modeling does not allow for this attribution of specific traits or parameters to individual agents. The agents represented in our model are humans, horses, birds, mosquitoes, and public health agents (see Section 3.1). These agents can be seen in Figures 1, 2, and 3, displaying the model’s interface. Notice the additional PHA agents in Figures 1 and 3, and that they are white with black ties and blue briefcases. Our model shows the agents’ movements in the interface and reveals patterns from their interactions over time. The flow of agent interactions in our model is based on the course of events flowchart shown in Figures 4 and 5. This type of modeling generates accurate small interactions between agents in order to give a comprehensive understanding of the behavior pattern. Our Agent-Based Model analyses the interactions of its agents to track the SIR (Susceptible-Infected-Recovered) rates of WNV. Section 3.1 describes the actions of the agents in greater detail.
.png)
_integrated_amongst_the_other_mo.png)


3.1 Model Agents and Parameters
3.1.1 Mosquitoes
Mosquitoes are more complex than most of the agents in this model since their behavior relies heavily on temperature (Polwiang, 2015, Abstract Section). Unlike other agents, we modeled their entire life cycle by incorporating temperature dependency on vital rates (i.e., Mosquitoes must hatch, mature from larvae into adults, possibly lay eggs of their own, and die based on the temperature). Initial parameters of a mosquito agent include traits such as life stage, lifespan, SIR-state, the chance of laying eggs, and exposure to infected birds. All adult mosquitoes, except the amount selected to be “infected mosquitoes,” begin as susceptible to WNV at the start of each run. Since we initialize all other agents as susceptible to WNV at the start of each run, the infected mosquitoes serve as the source of WNV for the entire model run.
Since the average lifespan of a Culex mosquito is between seven days and one month, we set the mosquito lifespan to a random number between zero to 14 days, or about 2 weeks (Bustamante, 2019, How Long do Mosquitoes Live? Section). Similarly, the chance that the mosquito will lay eggs is assigned a random number less than or equal to ten and updated throughout the simulations. We assume, to hatch eggs, the mosquito’s random chance of laying eggs must be greater than seven. Since there is a three out of ten chance, the random number will be greater than seven, each mosquito has a 30% chance to lay eggs on any given day. This method also ensures that not all mosquitoes are laying eggs and hatching at the same time. Additionally, since mosquitoes need water to survive and lay eggs on, the model only allows mosquito agents to move randomly around the pond from where they hatched.
The infection of a mosquito depends on the number of interactions between infected birds and mosquitoes (Hodgson, n.d., How does West Nile Virus Spread? Section). As previously mentioned, birds and mosquitoes are natural hosts, so they are only infected by each other. Once a mosquito becomes infected, it can infect other agents in the model until the mosquito dies (Hodgson, n.d., How does West Nile Virus Spread? Section). Mosquitoes do not recover from WNV as they already have relatively short lifespans; they primarily spread the disease. We also assume that if at any time the temperature moves outside the range habitable for mosquitoes or if a mosquito reaches their lifespan time, then 20% of the mosquito population dies (With the exception that at least one infected mosquito must remain alive to continue the disease simulation). This process will ensure that mosquitoes’ survival limits are present in the model, but not all the mosquitoes die at once.
3.1.2 Humans
The WNV-PHAs model version is most helpful in evaluating the effectiveness of human agents. This model version highlights the impact of PHAs teaching prevention methods and mosquito extermination on human infection and recovery rates. Some examples of prevention methods are using bug repellant, learning to eliminate stagnant water sources, and wearing clothing that covers the skin to minimize areas available to be bitten (CDC, 2019, Prevention Section). All humans in our model move randomly outside bodies of water, initialize as “susceptible” to infection, and have a recovery time set to a random number between 7 and 14. This random recovery rate value reflects that a human’s average recovery time is 7 to 14 days. All humans in our model can recover since most people with WNV make a complete recovery (CDC, 2019, Symptoms, Diagnosis, & Treatment Section).
Human infection relies heavily on temperature since mosquitoes are more active in certain temperature ranges (Polwiang, 2015, Abstract Section). For this reason, we integrated the temperate-dependent equations (Equations 1 and 2) for mosquito biting and infection rates.
(1)B(t)=.0943+.0043t for 21∘C<t<32∘CB(t)=0 for t<21∘C for t>32∘C
(2)I(t)=.0729(t−.9037) for t<26.1∘CI(t)=1 for t>26.1∘C
Our model applies these equations to mosquito biting rates and infection rates. To find the percentage of humans bitten by mosquitoes, we used the results of Equation 1 and multiplied that output by the entire population of healthy humans. We then used Equation 2 to compute the number of bitten humans that would be infected. Although the equations are pertaining to the Aedes Aegypti species of mosquito, which spreads dengue fever, we can reasonably use them as an approximation for our model since we included the Thailand temperature as well. There will be some margin of error with this approach, but it is still the most effective approach until more research is done on Culex mosquitoes (refer to Section 5.3). We chose to do this because it was the most viable option, and the random assignment was a vague alternative.
To simplify our model, we assume that human recovery relies on a randomly assigned number larger than the set recovery time. This assumption is reasonable because there was no known equation for recovery, and there are many factors that contribute to an individual’s recovery (e.g., age, immune system, genetics, etc.).
3.1.3 Public Health Agents
Public health agents (PHAs) act more like catalysts than as other agents in the model, as they do not get infected. They do not have many parameters of their own, but PHAs do play an impactful role in changing the infection and recovery rates of humans and horses. They do this by teaching the human agents prevention methods previously mentioned, such as using insect repellants, wearing long sleeves and pants, and identifying stagnant water sources. PHAs are also responsible for mosquito extermination, which in our model means killing mosquitoes within a set radius of the PHA to emulate the result of fogging or spraying. These techniques were verified and frequently used by experts at the Southwest Mosquito Abatement & Control District in Washington, Utah (Section 4.1). Our assumption was that with fewer mosquitoes transmitting WNV, and a smaller chance of infection due to advice from the PHAs, the infection rate of horses and humans would decrease. We will discuss the results of the model in Section 4 and Section 5.
3.1.4 Horses
The WNV model version best assesses and monitors horses. An On-Off Switch, located on our model’s interface, sets the vaccination status of the horses for the next 365 ticks (Netlogo’s unit of time is “ticks” which we equated to days for convenience), then the model stops and is reset. This setup allows the observer to see the causation that vaccines have on infection and recovery.
We assume horse agents require a fewer number of bites to become infected than the other agents in this model. This assumption ensures that the horses behave more realistic since horses have a high mortality rate when compared with other species (Equine Science Center, n.d.). For a vaccinated horse in our model, we increased the amount of exposure needed to become infected to show that it is less probable for a vaccinated horse to contract WNV.
In our model, horse recovery time is set to a random number up to 16 because horses can recover anywhere from 5 days to several weeks (Swinker, 2019, Treatment Section). However, only 50% of horses make a full recovery from WNV, 33% die from the disease, and the remaining 17% relapse (Swinker, 2019, Treatment Section). We incorporated this in our model by marking 17% of the horse population with a variable called “relapse”, which designates its horse to become “susceptible” to WNV again once they recover. For simplicity, we assumed that after one relapse of WNV, the horse either dies from the disease or recovers fully. Similarly, out of the remaining horses, 40% die when they become infected. Note, the percentage increase from 30% to 40% is because we took 17% of horses that relapsed out of the total population in the model. The other horses will fully recover, like human agents, when a randomly assigned number is greater than their recovery rate.
4. Model Validation and Results
4.1 Expert Consultation
A crucial part of building a robust agent-based model is determining useful parameter values for realistic agents while also being reasonably compatible with the other agents. We gathered our model’s parameter values in various ways. We researched some values, such as average recovery times, to find the known values. Other values (e.g., movements and death rates) we randomized within reasonable assumptions. Although we gathered information on mathematical and agent-based modeling from Jacintho et al. (2010); Kendrick et al. (2017); and Reyes et al. (2012), we also consulted with field experts at the Southwest Mosquito Abatement & Control District (SWMACD) to validate the values we used. They evaluated our data and verified their accuracy and reasonableness by comparing it to the information from their own fieldwork and analysis. In these consultations, we reviewed information from mosquito habits to recovery times, hatching rates to temperature dependencies, and much more. This information helped form the behaviors of our agents. They also shared the techniques their field workers use to mitigate the mosquito population; thereby, decreasing mosquito-borne disease, which we used as the basis for the WNV-PHAs model version.
4.2 Parameter sweeping
Parameter Sweeping was also integral in solidifying the cohesiveness and verifying the simulation results of the model. Parameter sweeping is the process of running the model a multitude of times under varying circumstances to summarize the model’s behavior. One can then conclude the data given by the sweep. The parameter sweeping is beneficial as it provides a useful alternative to tediously running the model multiple times and individually recording the data from each run. NetLogo has a parameter sweeping program built into its “Behavior Space” tool. It allows you to either increment through a range of values or test specific values throughout the sweeps. As this technique monitors the model and changes your specified variables, it can report when the model meets the desired goal, record what other aspects of your model are doing, and stop according to the circumstances you choose to end the sweep. We used parameter sweeps to investigate the usefulness of vaccines and the effect of an increase of public knowledge on mosquito disease prevention.
In total, there were four parameter sweeps done to analyze our model. That is not to say the sweeps only completed four runs of the model; each sweep collected data from various runs - a run of the model cycles through 365 “ticks” representing 365 days or one year. For example, the sweeps of the WNV model version simulated the model with three different values for infected mosquitoes (15, 25, and 35) and repeated runs of each of those instances five times, totaling 15 runs altogether. Since so much of the model is random, each run will return slightly different results, but this allows us to draw the average behavior from the reported results.
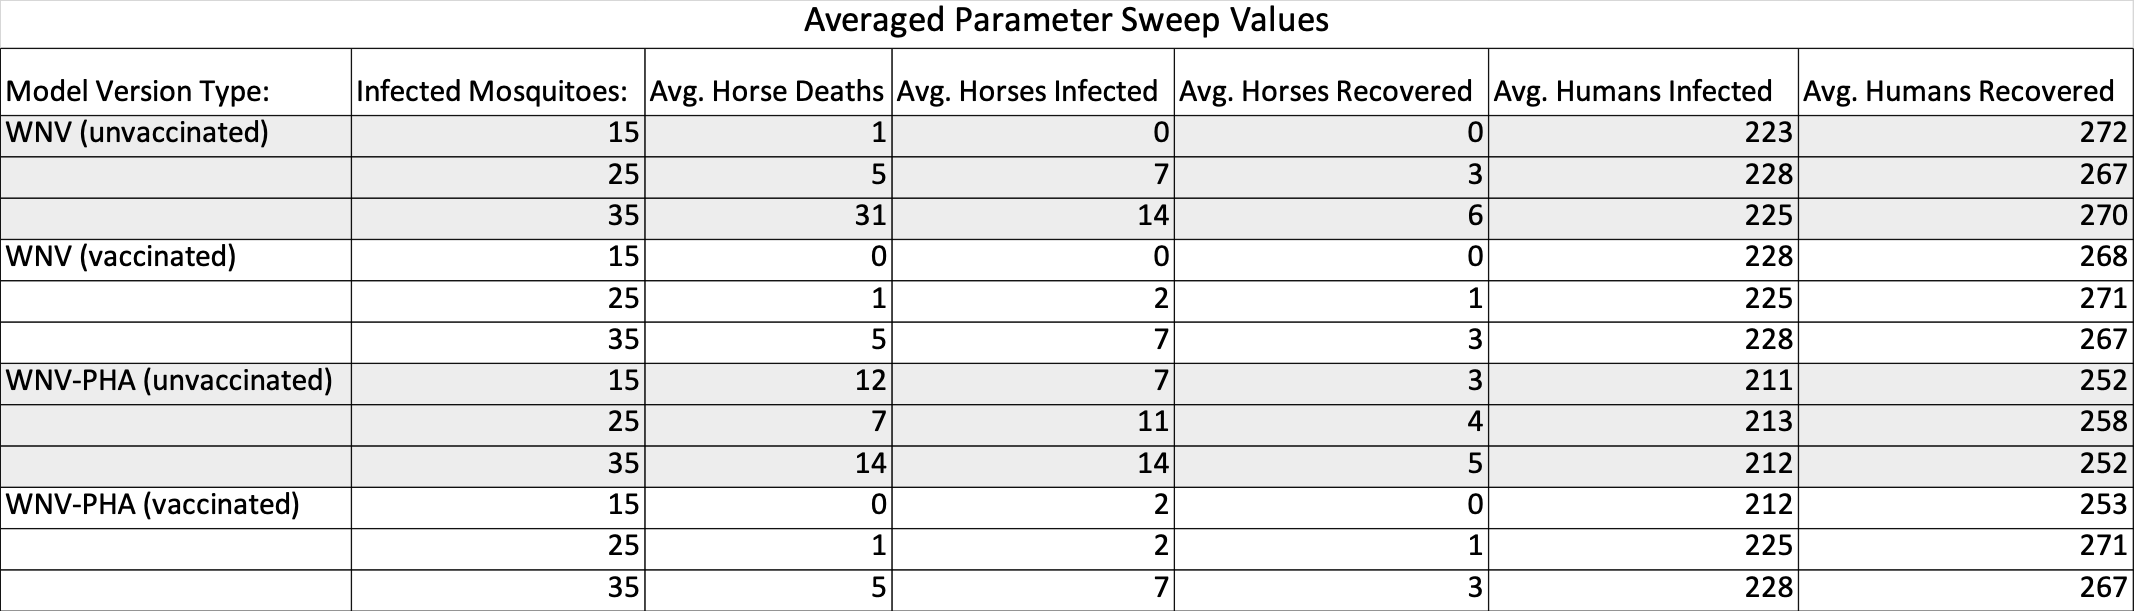
All our parameter sweeps for this model recorded the number of horse deaths, infected horses, recovered horses, infected humans, and recovered humans at the end of each run. They each recorded the behavior with 15, 25, and finally 35 infected mosquitoes and repeated each test five times. The differences in the parameter sweeps centered around the two model versions and whether we chose to vaccinate the horses or not. Therefore, the four sweeps we ran were: i.) the WNV model version with vaccinated horses, ii.) the WNV model version without vaccinated horses, iii.) the WNV-PHAs model version with vaccinated horses, and iv.) the WNV-PHAs model version without vaccinated horses. The control group was the WNV model version without vaccinations, as it includes neither PHAs nor vaccinations. We then averaged the simulated results and recorded the averages in Table 1.

4.3 Parameter Sweep Results
The number of infected and recovered humans was closely analyzed to measure the effects on human disease dynamics. With 15 infected mosquitoes in the model, infected humans averaged 43.7% of the human population, while 52.25% recovered. When increased to 25 infected mosquitoes, the model produced an average of 44.55% infected, and 53.35% recovered. Finally, with 35 infected mosquitoes, the averages came to 44.65% infected, and 52.8% recovered. This simulation shows that our model produces consistent results that reflect what we would expect from an SIR model. These results are expanded on in Section 4.3.1 through Section 4.3.3.
The results of vaccination effectiveness relied upon the estimated average number of horse deaths, infections, and recovery across all sweeps. For runs with 15 infected mosquitoes, the horses tended to have lower death, infection, and recovery rates simply because fewer infected hosts existed. For this reason, this paper excludes their specific percentages, but their behavior was still considered and computed in the data set for all other general conclusions.
4.3.1 25 infected mosquitoes
For runs with 25 infected mosquitoes and unvaccinated horses, the WNV model showed that 1% of horses died, while only 0.6% recovered. Still, 1.4% of horses remained infected at the end of these runs. When implementing Public Health Agents, the recovery rate increased to 0.8%. In vaccinated horses for both model versions, the average death rate, equal to the recovery rate, was 0.2% of the total horse population, and the infected percent remaining comprised only 0.4% of the population.
4.3.2 35 infected mosquitoes
The data for the 35 infected mosquito runs with unvaccinated horses reveal a 6.2% death rate, a 2.8% recovery rate, and 1.2% infected remnant in the WNV version. Integrating Public Health Agents dropped the death rate to 2.8%. Vaccinating horses in both versions lessened the death rate to 1%, the recovery rate to 0.6%, and the infected to 1.4%.
4.3.3 Overall Behavior
When considering all data, the results reveal that human disease dynamics are most significantly affected by the Public Health Agents’ efforts at implementing general knowledge of preventable measures and exterminations. By comparing the average number of infected humans from each model version’s sweeps, we concluded that humans are 4% less likely to contract WNV with the Public Health Agent implementation. However, once infected, their recovery rates were not affected by the presence of PHA.
Contrastingly, implementing vaccines contained horse disease dynamics more efficiently than PHAs. Throughout all parameter sweeps, implementing vaccinations dropped the death rate by 1.67%, the infection rate by 1.1%, and the recovery rate by .43%. The reduced recovery rate reflects that there was a smaller number of infected horses available to recover. Overall, the results verified our hypothesis that both Public Health Agents and vaccines would mitigate WNV in horses and humans (Section 3.1.3).
5. Results and Discussion
5.1 Conclusions
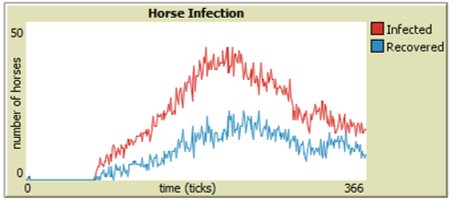
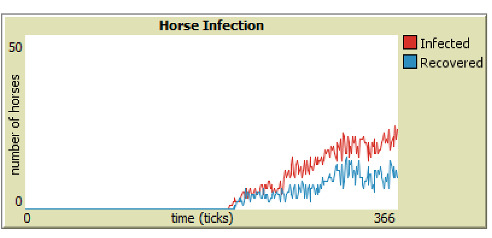
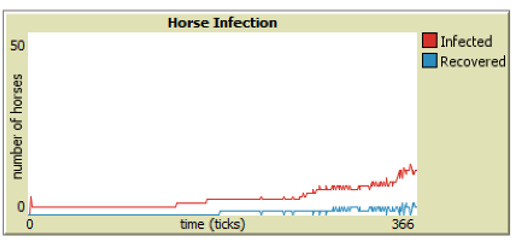
As discussed in Section 4, parameter sweeps are helpful to assess large groups of data, but our model is also programmed to generate human and horse SIR-graphs to monitor the specific behavior of each run. From Figures 6 through 9, it is easy to see that integrating vaccinations significantly decreases horse infection and death rates in both model versions. Adding Public Health Agents to the model dynamics not only reduced horse infection but lowered the peaks of infection from the runs of just the WNV model version (Figure 8). Furthermore, the infection-rate reached a minimum when we combined health agents and vaccinations in the same environment (Figure 9). This result shows that both horse vaccinations and public health agents effectively reduced the rate of infection for horses. However, the graphs also reveal that within the constraints of our model, vaccinations were more effective than health agents at mitigating the disease within horses.


6. Future Work
Although our model gives a better depiction of WNV interaction, greater analysis of an optimum range of infected mosquitoes would improve the model’s usability. It would be useful to find an optimum range for the number of infected mosquitoes, in which outliers would either cause the model to produce minimal data or cause the infection to grow exponentially with no indication of recovery. These numbers could then restrict the number of infected mosquitoes that can exist in the model.
More investigation into horse, bird, and mosquito infection rates would also be desirable to continue this research. Attaining infection rate equations for our model agents would increase the reliability of the model. We could not find enough work done with Culex mosquitoes, the common carriers of WNV, to formulate biting or infection-rate equations. More research into western countries’ temperatures and their relation to Culex mosquito behavior would help develop a more accurate model for the United States to implement.
Our future work would include questions related to the integration of a Geographic Information System (GIS) platform into the NetLogo environment of the model and its impact on the regional outbreak of the disease. This integration would provide a basis for applying the model to the local climate. It would allow us to increase the authenticity and accuracy of the model by making more temperature and climate data available to implement into agents’ individual attributes. With these improvements, this model could analyze WNV dynamics in a wide variety of locations and climates.
Acknowledgments
This work would not have been possible without funding from Dixie State University’s Undergraduate Research Office, the Southwest Mosquito Abatement & Control District’s Scholarship Program, and DSU’s Student Government, so we would like to thank them for their funding. We want to thank the Southwest Mosquito Abatement & Control District (SWMACD) for sharing their insight and expertise on mosquitoes throughout this research project.