


Reprinted with Permission from the DSU Institute for Social Research
Introduction
Jane Alpha and John Beta are dramatic case examples of freshmen at Dixie State University (DSU). Jane chose to come to Utah from her home state of New Mexico and John grew up in the local city of St. George. Both are taking the same classes and come from similar socioeconomic backgrounds with parents making a combined income of $75,000 or more per year. DSU bolsters a diverse and active college experience, but what of the quality of life to its students? The Institute for Social Research built a survey to gather information on five cost variables: tuition, including the cost of books and fees, supplies with groceries, meal plans, transportation, housing, and the availability of jobs and resources to pay for the needs of the students. The hypothesis of the research is that DSU will have a competitive quality life for freshman students when compared to other schools of similar locations and populations.
The survey consisted of 47 questions and was estimated to take 10 minutes to complete. The 123 participants were selected from students who took Sociology 1010 in the spring semester of 2019. The responses would be used to measure opinions, collect data on employment, meal options, supplies used, transportation, and resources to pay for tuition, textbooks, and fees. Further, the team used content analysis to compare the information gained from the survey and other resources offered by DSU admissions and registration tools. The data collected was then analyzed to operationalize the six propositions: tuition, fees, and textbooks are educationally valuable and competitively priced, students save money by using the meal plans, the cost of supplies needed to learn puts education in reach of all students, alternative transportation is available to students at low cost, students are able to find jobs and use school parental and government resources to cover the cost, and that housing is available at prices comparable to other schools.
The data shows that though tuition and fees are competitive in price in Utah, most students worry about covering the cost of tuition. DSU has low meal plan costs, but students do not take advantage of the program. For those that are on a meal plan, 59% felt it was not a balanced option for them. Students selected a preference for local grocery stores at 93%, followed by fast food at 68% for their food needs. DSU has a free ride deal with SunTran, the local community bus transit company, but only two students responded that they used it. Students can find employment with 65% of participants responding that they do have a part time or full-time job. Housing is comparable to the market of St. George and the other colleges of its size at $1,699 per semester. The quality of life for our freshman students Jane and John is in their own hands. The resources are available if they choose to use them and if they are wise consumers.
Class Schedule, Tuition, Fees, Textbooks
CLASS SCHEDULE
The classes for our case study of two freshmen students at DSU taking general education classes include Introduction to Writing (English 1010D, a 4-credit class), College Algebra/Precalculus (Math 1050, 4 credits), General Biology (Biology 1010, 3 credits), General Biology Lab (Biology 1015, 1 credit), and Introduction to Sociology (Soc 1010, 3 credits). All these classes together add up to the 15 credits needed to fulfill the general education requirements at DSU.
English 1010D fulfills the general education English requirement, Math 1050 fulfills the general education mathematics requirement, Biology 1010 coupled with Biology 1015 fulfills the life sciences requirement, and Sociology 1010 fulfills the social and behavioral sciences credit.
English D Monday, Tuesday, Wednesday, Thursday 8-8:50am
Sociology Monday, Wednesday, Friday, 9-9:50am
Biology Monday, Wednesday, Friday, 10-10:50am
Biology Lab Monday 5-7:50pm
Math Tuesday, Thursday 5:15-6:55pm
FEES
Our students will be enrolled in 15 credits. For these classes, the student fees come to a total of $397.50 per semester for each student. These fees listed in the table below do not include any additional lab fees or fees for classes offered online. For our study, the students will be taking a Biology lab. The required lab fee for this class is $75.
TUITION
The Good Neighbor discount applies to students who are part of Lincoln County Nevada and Clark County Nevada. In state tuition costs $2,229.00 per semester. Fees for 15 credits cost $397.50 per semester. The cost of tuition and fees for a resident student attending 15 credit hours at DSU is $2,626.50 per semester.
The cost of tuition for our resident student John Beta would come to a total of $2,626.50 a semester. There would be an additional charge of $75 for his lab fee that is included in his general education schedule. The total cost of his tuition and fees for the semester comes to $2,701.50. The cost of tuition for our non-resident student, Jane Alpha, comes to a total of $7,525.50 per semester. Her schedule also includes a $75 lab fee. The total cost of her tuition and fees for the semester comes to a total of $7,600.50.
TEXTBOOKS
Textbook Purchasing Options
Students have the option to acquire their textbooks from whichever resource they have access to. Students are not required to get all their books from the DSU bookstore, though some books are only available at that location. At the DSU bookstore, some of the textbooks are available used, as an E-Book, or as a rental. If the textbook isn’t available used, as an E-Book, online, or as a rental, the student can purchase the new textbook at full price.
Amazon has a large selection of rental textbooks for students to rent for the length of the semester. At the end of the semester, there is free return shipping for students to return their textbooks. Textbooks are generally available to be purchased used if there isn’t a rental option on Amazon. If the textbooks cannot be acquired as a rental or be purchased used, Amazon has a large selection of new books that students can purchase. There is a chance that all the required textbooks will not be available through Amazon.
Another popular location for students to purchase textbooks is from Chegg. They have a large selection of textbooks as rentals or as E-Books. Textbooks can also be purchased from Chegg. If orders exceed $35, there is free two-day shipping available. There is a chance that Chegg will not have all the required textbooks available.
Other options for acquiring textbooks include Thriftbooks and downloading E-Books from alternative sites. Thriftbooks is an online website where books can be purchased used for a low price. Depending on the cost of the book, the order can qualify for free shipping. Textbooks can also be purchased from other websites or downloaded as E-Books onto tablets, phones, and computers. A few of the textbooks are available at the on-campus library on the reserve list, as well. The library reserve list allows students to have access to textbooks for a few hours at a time, giving students the option to make copies, take notes, and read the textbooks for completing assignments. This is not a comprehensive list of purchasing options for textbooks.
Required Textbooks
The textbook The Norton Field Guide to Writing with 2016 MLA Update: with Readings and Handbook (4th ed.) is the required text for English 1010D. This textbook is available at the DSU bookstore. To purchase this textbook, the total would be $85.00 new, $59.95 used, $46.50 as a new rental, and $32.50 as a used rental. On Amazon, this textbook can be purchased new for $57.89, used for $50.86, or rented for $47.84. On Chegg, this textbook can be purchased for $45.49 or rented for $14.99. These prices do not include sales tax.
The textbook Campbell Essential Biology (6th ed.) is the required text for Biology 1010. This textbook is available at the DSU bookstore to be purchased new for $181.95 or used $59.95. It can also be purchased as a loose leaf at the bookstore for $29.95 or as an E-book for $37.99. On Amazon, this textbook can be purchased new for $161.48, used $74.86, or rented for $23.00. This book is not available for purchase or rental on Chegg. There is also a required General Biology Lab workbook that is $36.80 at the bookstore. It is also available on Amazon for $36.80. These prices do not include sales tax.
There are no required textbooks for Math 1050.
The textbook Essentials of Sociology (9th ed.) is the required text for Sociology 1010. This textbook is available at the DSU bookstore to be purchased used for $79.95. An E-book is also available in the bookstore for $25.49. On Amazon, this textbook can be purchased new for $115.92, used for $55.31, or rented for $20.49. On Chegg, the textbook can be purchased for $60.99 or rented for $20.99. These prices do not include sales tax.
To purchase all required textbooks new at the DSU campus bookstore (Essentials of Sociology is only available used), the total cost would be $383.70 plus sales tax. To purchase all required textbooks used (aside from the biology workbook which must be purchased new at the DSU bookstore) at the campus bookstore would cost $236.65 plus sales tax. A few of the required texts are available at the DSU bookstore for rental, loose-leaf, or E-book which would also aid in reducing costs. To purchase all the books new on Amazon, the total cost would be $372.09 plus sales tax. To purchase all the books used on Amazon (aside from the biology workbook), the total cost would be $217.83 plus sales tax. To rent all the books on Amazon (aside from the biology workbook), the total cost would be $128.13 plus sales tax. Not all textbooks are available on Chegg.
If our students were to use a combination of the cheapest available options for their textbooks, they would rent Essentials of Sociology from Chegg ($20.99) and rent The Norton Field Guide to Writing with 2016 MLA Update: with Readings and Handbook from Chegg ($14.99). These two books are being rented from Chegg because together they qualify for free two-day shipping for orders costing over $35. If these books weren’t purchased together, there would be an additional charge for shipping. The biology workbook will be purchased from either Amazon or the DSU campus bookstore ($36.80). The biology textbook, Campbell’s Essential Biology, will be rented from Amazon ($23.00). This would allow both students from our case study to purchase all their required textbooks for $95.78 plus sales tax. Sales tax is 4.7% in the state of Utah, which means textbooks could be purchased for $100.28.
RESULTS
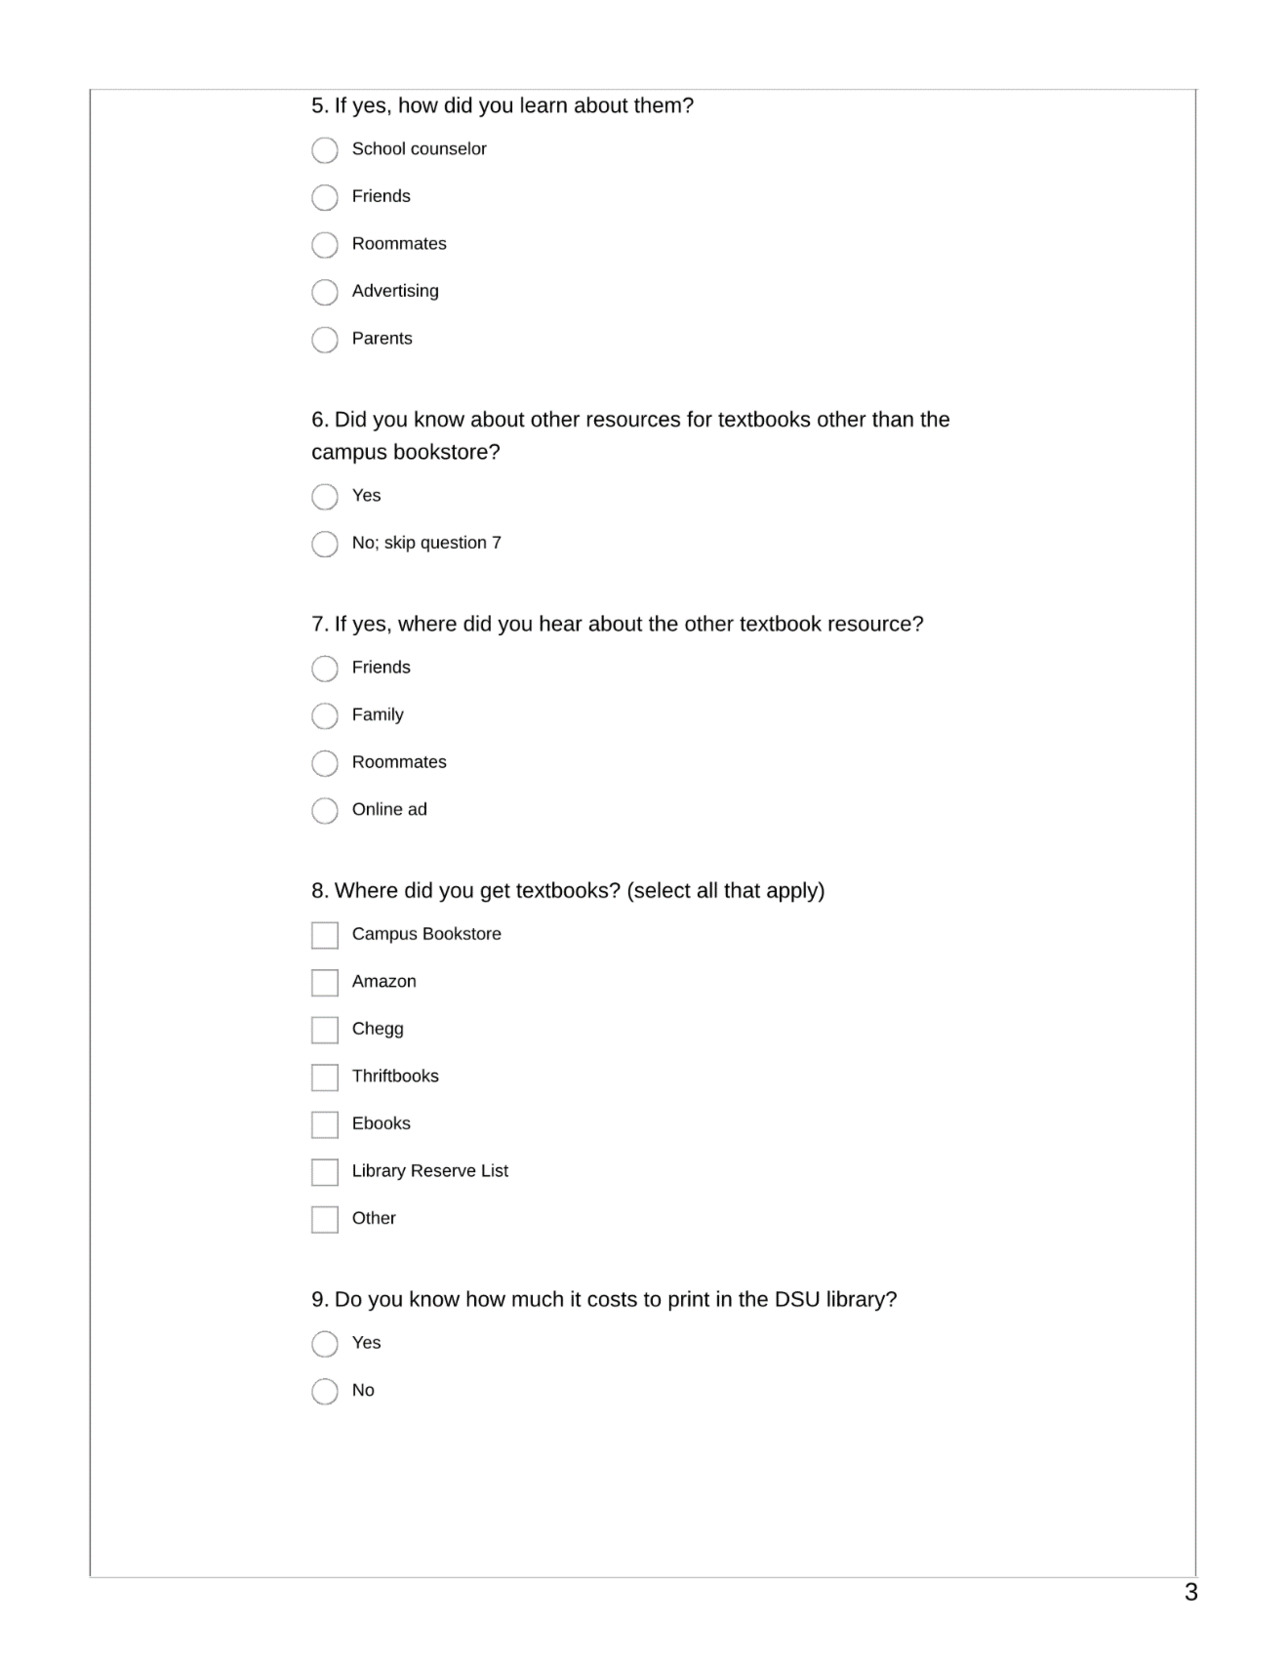
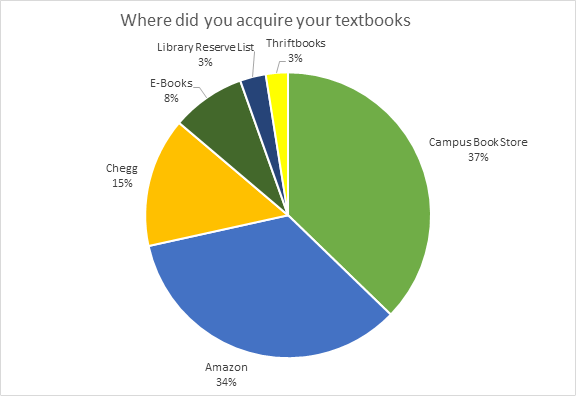
Where did you acquire Your Textbooks?
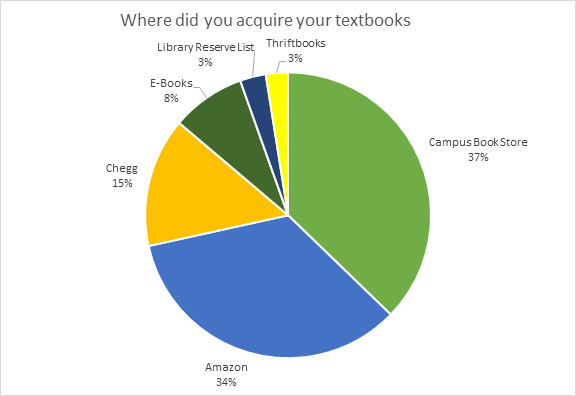
In the survey designed by the ISR, freshman students were asked where they acquired their textbooks for the semester. It was hypothesized that the DSU bookstore, Amazon, and Chegg would be the most popular locations to acquire textbooks. This is because these are the most well-known resources for textbooks.
Of the students surveyed, 37% reported that they acquired their textbooks from the DSU bookstore, although it is unknown if students purchased or rented their textbooks from there. Textbooks could have also been acquired from the bookstore as E-Books. The second most popular place for acquiring textbooks was Amazon, with 34% of students getting their textbooks there. It is unknown if students purchased or rented their textbooks from Amazon. They could have also been acquired as E-Books. The survey gave students the option to select more than one answer when responding the question of where they acquired their textbooks. Some students reported that they purchased their textbooks from multiple locations in order to get the best price available.

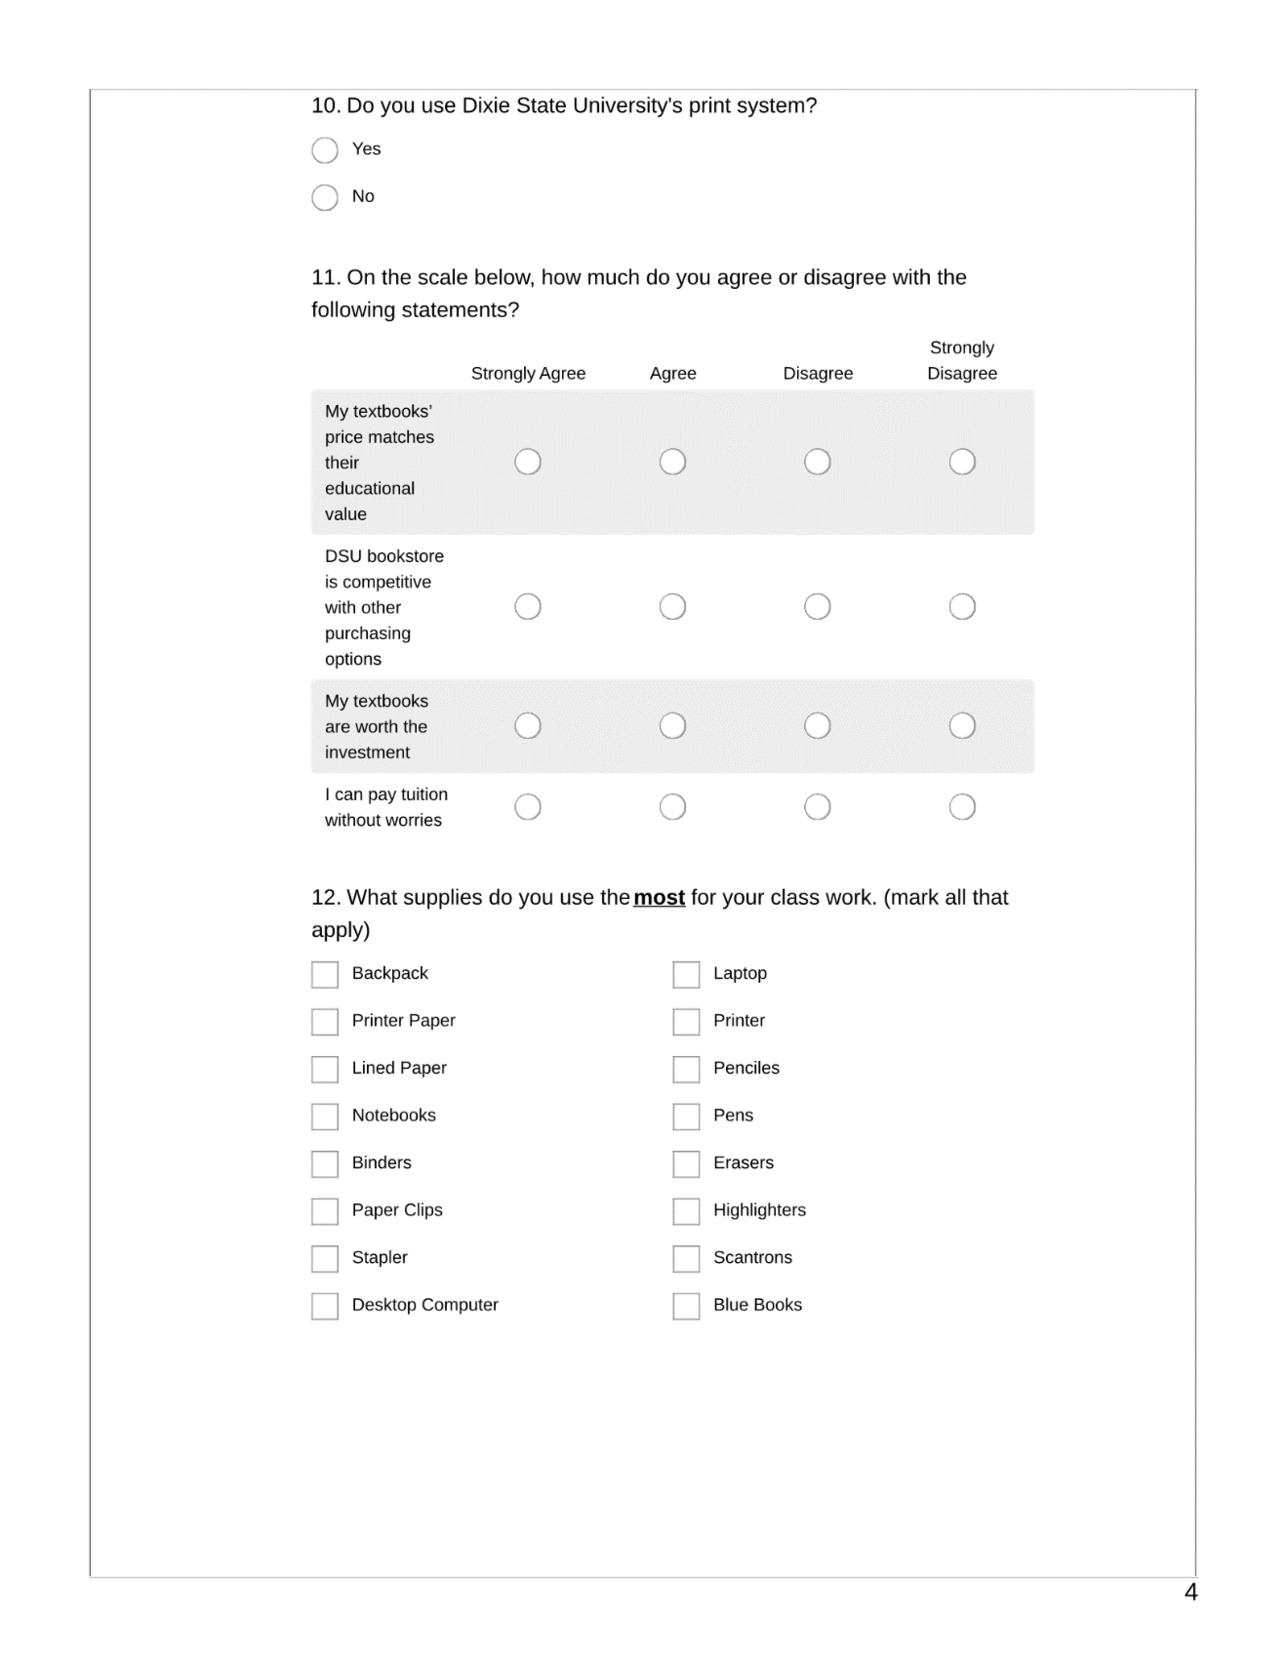
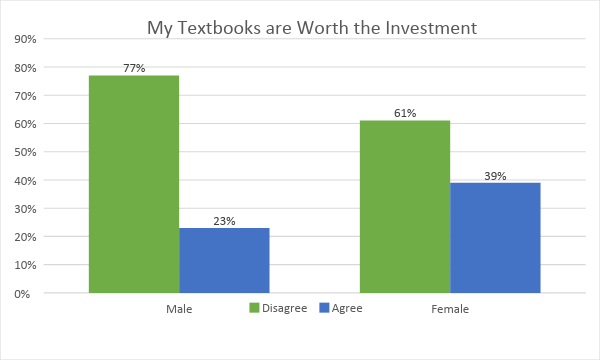
The survey asked students if they agreed that their textbooks were worth the investment. This question was designed to test if students thought they used their textbooks enough to make them worth purchasing. Many textbooks are required by instructors but get very little use. Some professors have removed textbooks from the class requirements altogether and have posted online segments of the books directly into the curriculum for the semester. This is done to cut down on the cost of textbooks for the students. This also gives all students in the class access to the textbook if they don’t have the money to purchase it for the semester.
For the purpose of this study, the variables Agree and Strongly Agree were combined into the singular variable Agree. The variables Disagree and Strongly Disagree were condensed into the variable Disagree. Of the survey participants that were male, 27% said that their textbooks were not worth the investment. 23% of the male survey participants agreed that their textbooks were worth the investment. Most of the male students who were surveyed did not agree that their textbooks were worth the investment. Of the female survey participants, 61% reported that their textbooks were not worth the investment, while 39% said that the textbooks were worth the investment. A high percentage of both male and female students did not agree that their textbooks were worth the investment.
The survey designed by the ISR asked freshmen students if they agreed that their textbooks matched their educational value. It was hypothesized that students would report that they did not agree that the price of textbooks matched their educational value. This is because textbooks typically cost at least $100 when purchased new. There is new popularity in acquiring textbooks as rentals, which has greatly cut down on the cost of textbooks. This was assumed to be an influencing factor when asking students if they thought their books would match their educational value.
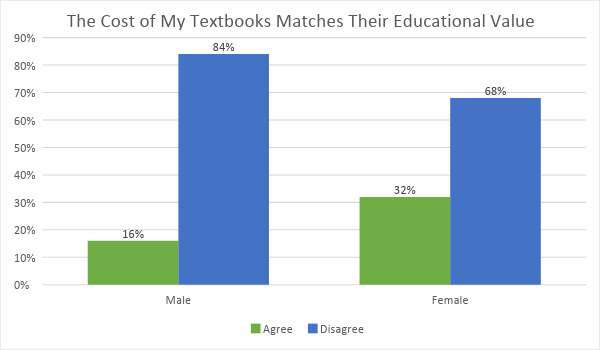
Of the students surveyed, 84% of males reported that their textbooks were not worth their educational value. 68% of females reported that their textbooks were not worth their educational value. Freshmen students think they are paying more than the textbooks are worth.
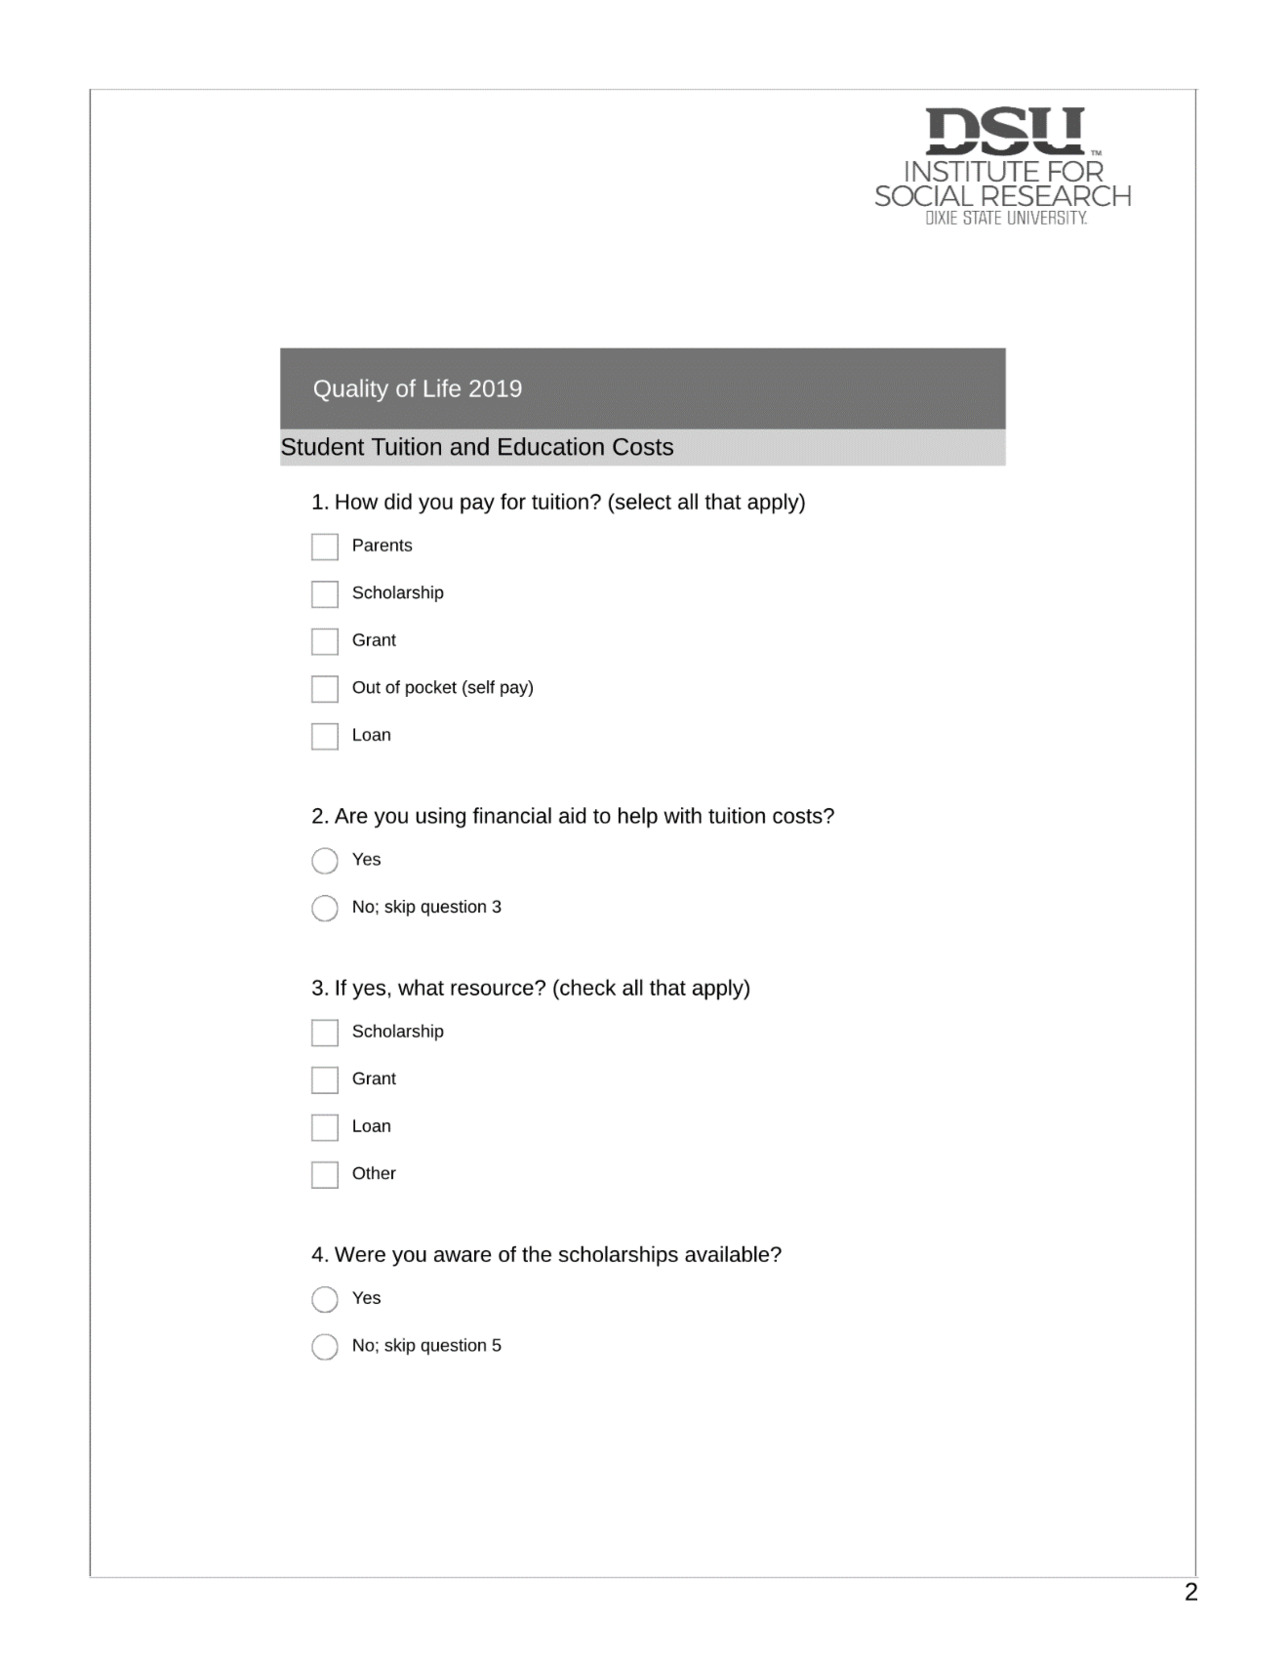
How Did You Pay Tuition?
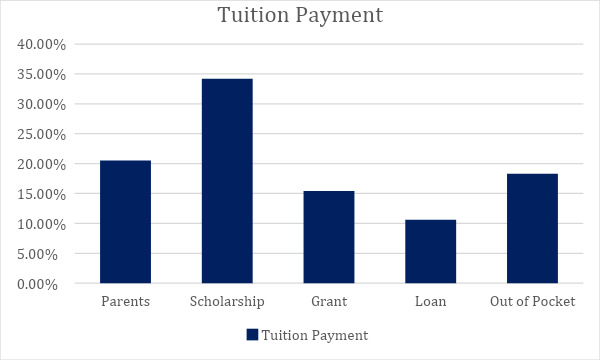
The survey created by the ISR asked freshman students how they paid for tuition. This was done to determine if students were aware of the resources that available to them while attending college. This also tested if students were taking advantage of the resources available to them, such as scholarships or grants. It was hypothesized that many students would pay for tuition through a scholarship or loan. The results of this question are available below in Figure 4.
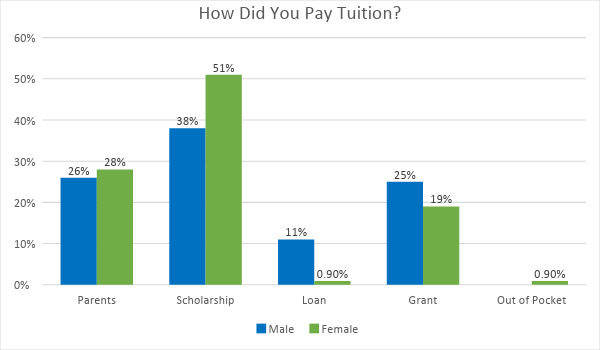
Male students were compared to female students in the ways that they pay for tuition. Of the students surveyed, the most popular method for paying tuition by both male and female students is a scholarship. The second most popular method for paying tuition is by parents.
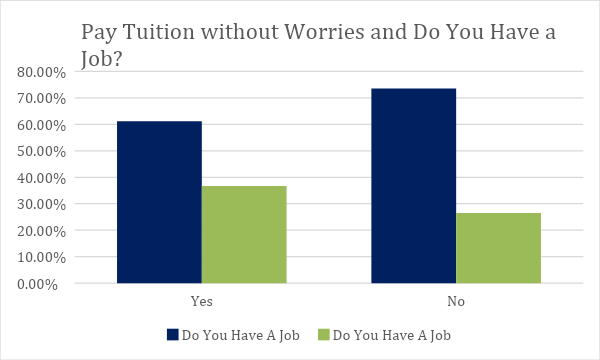
I Can Pay Tuition Without Worrying About the Cost
Students were asked if they were concerned about the cost of tuition. This was done to determine if students were concerned about paying for other expenses while attending DSU. This was also done to determine if students thought that the cost of tuition was too high.
The number of students saying they were concerned about paying compared to being unconcerned is similar. This could be because most of the students who were surveyed had a scholarship as a resource for paying tuition. This could also be because a large percent of the students surveyed were relying on their parents to help pay for the cost of tuition. Most of the students surveyed reported that they were concerned when they had to pay tuition. This could be because scholarships and/or parents don’t cover the entire cost of tuition and the student is left to make up the difference. This could be a major concern for a first-year freshman who doesn’t have a well-paying job or knowledge of/access to other resources put in place to alleviate the cost of tuition.

Student Cost Analysis
Almost all respondents reported using backpacks, which makes sense, given the various supplies needed for classes. A low percentage of people used loose leaf paper, but a higher percentage used a printer. Assuming not all respondents who used a printer used their own and possibly did not contribute paper to the printer would explain the discrepancy in the number of respondents saying they used printers, compared to the ones who used printer paper. Most respondents also reported obtaining a laptop for school, which also makes sense, given that a lot of course work is completed using Canvas. We ran a correlation coefficient to measure a correlation between printer use and the DSU printer system. A high positive correlation exists between those who do not use printer paper compared to those who use the print system. An even higher positive correlation exists between those who do not use a printer and those who use the print system. The assumption is that those who don’t have access to their own printer or a friend’s/relative’s are forced to use the DSU print system.
In analyzing the raw data, 93.5% of the respondents surveyed use the grocery store to obtain food. With this data in mind, a cost comparison study was conducted to determine the differences in the cost of food between St. George, Utah (DSU) and four other cities: Albuquerque, New Mexico; Las Vegas, Nevada; Salt Lake City, Utah; and Logan, Utah. Albuquerque is the town from which our fictional freshman student, Jane Alpha, hails from. Las Vegas, Salt Lake City, and Logan were chosen because they are near St. George and each city has a university within its limits.
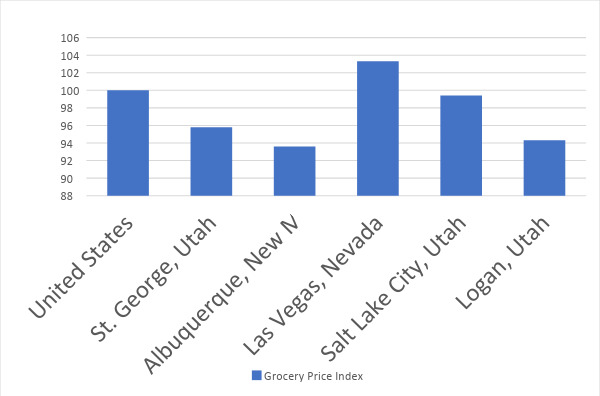
To conduct a cost analysis for food between St. George and the four other cities, an online cost of living calculator was employed: Sperling’s Best Places, www.bestplaces.net. The website provides an overall comparison of food and breaks down prices of 29 individual food categories. Using an index of 100 as the average for the country, each city is compared with the same index. Food and groceries overall for St. George yields an index of 95.8, while Albuquerque has an overall index of 93.6, meaning food and groceries are 2.4% cheaper in Albuquerque than in St. George. Las Vegas has an overall food cost index of 103.3, which is 7.3% higher than St. George. Las Vegas is also higher than the national index of 100. The overall price index for food in Salt Lake City is 3.6% higher than St. George, with an index of 99.4. Logan is 1.6% cheaper than St. George in overall food costs. The index for Logan is 94.3.
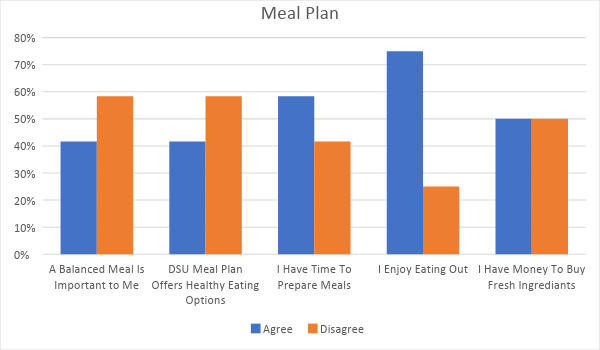
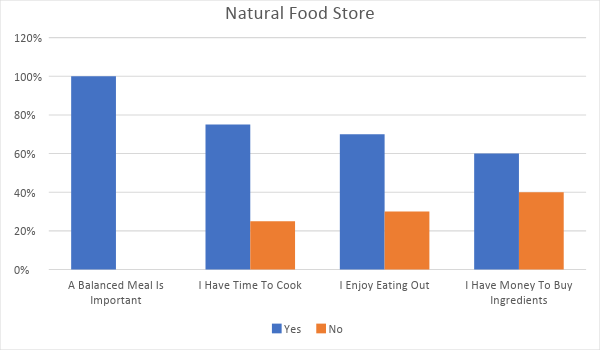
As shown in figure 7, there was a total of 12 students (9%) of the 123 students surveyed who stated they were on some sort of meal plan. Nine students of the 12 on meal plans (75%) answered yes when asked if they were on DSU’s meal plan, which means the remaining three students are on some other sort of meal plan. With the term meal plan being so vague, they could be on a diet plan, i.e. Nutrisystem or Weight Watchers. 41% of respondents on a meal plan stated a balanced meal is important to them. 59% stated that the meal plans at DSU do not have healthy eating options.

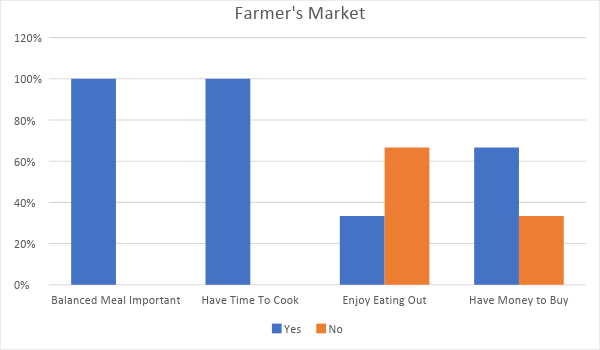
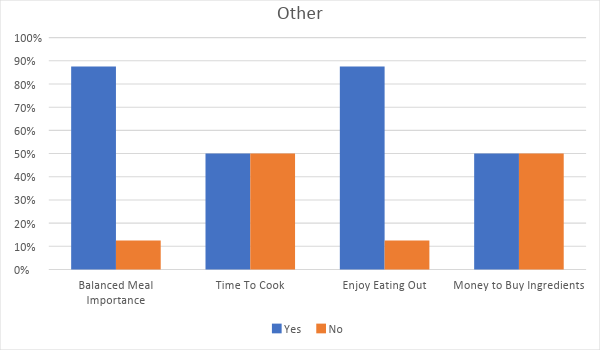
With three students who say they obtain food from a farmer’s market; we have an easy breakdown. All three students stated a balanced meal is important to them. They also have time to cook their own meals, which coincides with two of the three students (66%) preferring not to eat out. Two of the three students say they have money to obtain fresh ingredients, which means the other student might want to investigate a cheaper alternative for food than a farmer’s market.
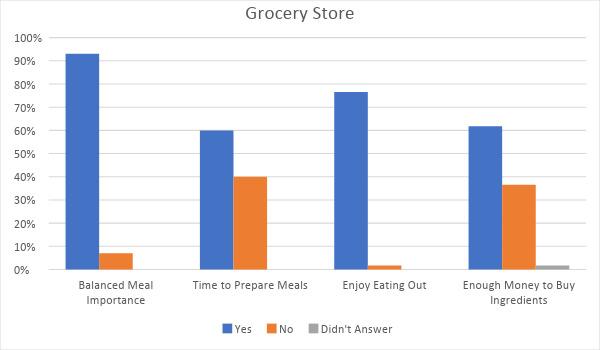
Almost all, 93%, of the respondents who stated using a grocery store to obtain food stated a balanced meal is important. At 60%, over half of respondents stated they have time to cook meals around their schedules. Just over three quarters, 76%, of respondents enjoy eating out. 61% of respondents have money for ingredients due to the lower cost of food in comparison with a farmer’s market or a natural food store, not to mention that sales that go on in grocery stores periodically, reducing the cost of food.
All students who obtain food items from a natural food store find importance in a balanced meal. 75% of respondents said they have enough time to prepare meals at home around their schedules. Most of the respondents (70%) enjoy eating out, which could mean they go out and find healthy choices. 60% of respondents stated they have money to buy fresh ingredients. The other 40% may need to think about changing their diet options because of the expensive nature of natural food stores.

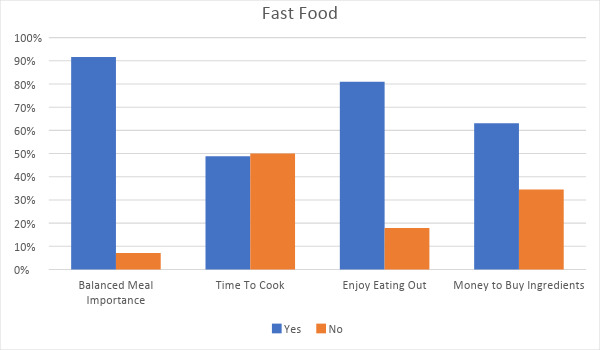
There was a total of 84 students who responded saying they go to fast food restaurants as a way of purchasing food. Of the 84 respondents, 91% stated a balanced meal is important. Less than half, 48%, of respondents stated they have time to cook. Most respondents (81%) stated they enjoy eating out. More than half, 63%, of the respondents surveyed stated they have money to buy fresh ingredients.

There were only eight respondents who stated they shop elsewhere for food. 87.5% of respondents stated a balanced meal is important. Half of the respondents state they have time to cook meals. 87.5% of respondents enjoy eating out. However, half of the respondents stated they have money to buy fresh ingredients.
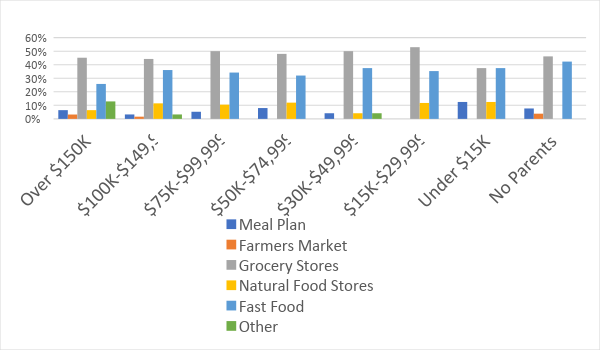
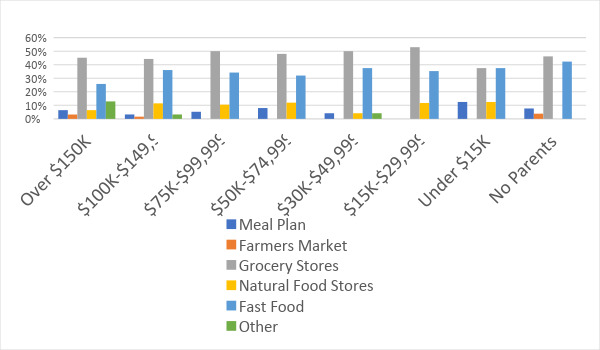
Two thirds (66%) of respondents who 23re using a meal plan stated they came from a household where parents make more than $50,000 annually. The remaining respondents’ parents (33%) make less than $50,000 annually or are deceased or removed in some way. The only students who reported using a farmer’s market for food were those who fell into the top tier of the socioeconomic level, minus one whose parents are absent in some way. Every socioeconomic background uses the grocery store to purchase food items. At least one respondent in every category uses a natural food store for food. Fast food was also represented across the board in all categories. Those who reported going elsewhere to purchase food items were from the upper spectrum of the socioeconomic categories.
Meal Plans

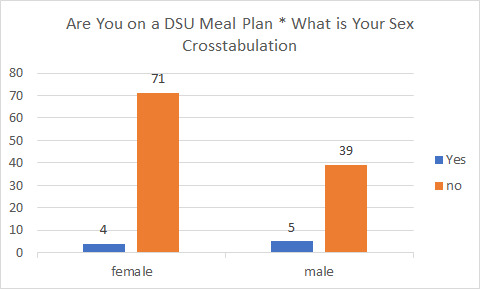
From the survey issued to students in entry level Sociology courses, the Institute for Social Research (ISR) team received 123 responses. This section of the study focused on Dixie State University’s (DSU) meal plans and student housing. From survey results, 40% of respondents lived locally with their parents and used a DSU meal plan. DSU offers four different meal plan options for students. Meal plans are priced by semester as follows: Plan A: $1,049, B: $1,349, C: $1,449 and D: $1,849. Out of the 123 survey respondents to answer the question, “Do you have a DSU meal plan?” 4 out of 75 females answered “yes.” From this group, 5 out of 44 lived locally with their parents and utilized their DSU meal plan. Only 26 reported paying out of state tuition, and out of this group, 9 had purchased a DSU meal plan (“Meal plans,” 2019).
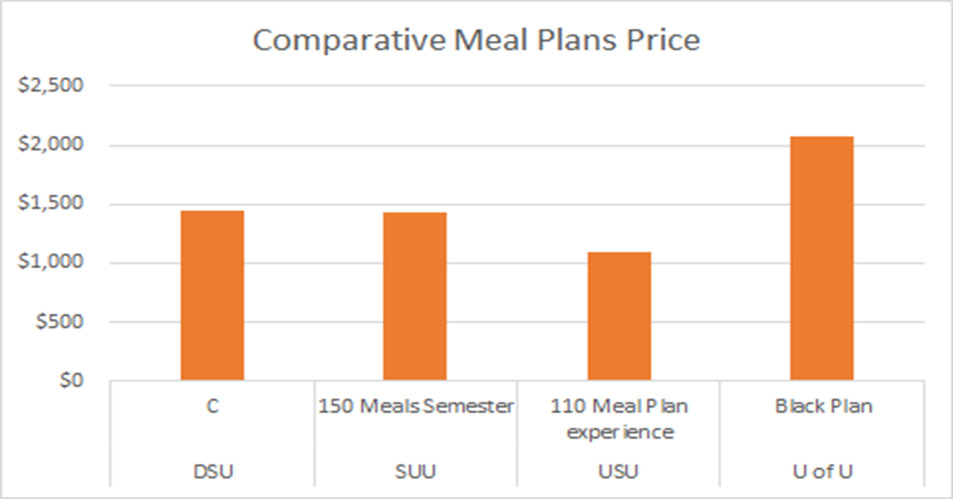
A comparison analysis of meal plans at Southern Utah University (SUU), University of Utah (U of U), and Utah State University (USU) revealed that DSU and SUU have affordable and flexible meal plans available to students. SUU has a similar meal plan to DSU plan C, and the cost of meal plan per semester is $1,430. This plan, much like DSU, allows students to shop at a variety of locations around campus for their meals, including the campus market (“SUU,” n.d.). USU has a $1,100 per semester meal plan that can only be used at two locations, the Junction and the Marketplace, limiting the variety of food choices for students (“Meal plan,” n.d.). The University of Utah had several meal plans to choose from. The Black Plan was the most cost effective at $2,076 per semester. Two other comparable meal plans exist at the U of U. The White Plan costs $996 per semester; however, only students living in a pod or loft were eligible to purchase the White Plan. Lastly, the 40 Block Plan at $935 per semester was only offered to students living in Benchmark Plaza, Downtown Commons, Officers Circle, Marriott Honors Community, Shoreline Ridge, Cedar Court 700, or U of U at Block 44. Due to the housing restrictions students had to meet before being eligible for these meal plans, these meal plans were not included (“Housing,” 2020).
Transportation
INTRODUCTION
As part of the Dixie State University Quality of Life Initiative, this research project focuses on freshmen students currently enrolled at DSU. What kind of lifestyle does a student have while they are attending school? To answer this question, the Spring ISR team focused on these categories: housing, meal plans, transportation, tuition and fees, employment, school supplies, and demographics. For the category of transportation, the ISR team looked at how these students were getting to class, what they knew about the various transportation options St. George has to offer, and what they thought about current gas prices.
What the team found interesting is that only 2 students out of the sample population of 123 students took the SunTran bus, especially considering students can ride the bus for free with a valid student ID card. In this study, we also looked at how many students knew about the SunTran bus, as well as other student discount options, and how this could relate to the other selected categories. This Quality of Life Initiative research project will be helpful for current students and other individuals who may be interested in going to school at Dixie State University.
METHODS
The ISR team conducted a survey to students in Sociology 1010 classes. After the students took the survey, the team analyzed the data and did a write up of the findings.
RESULTS

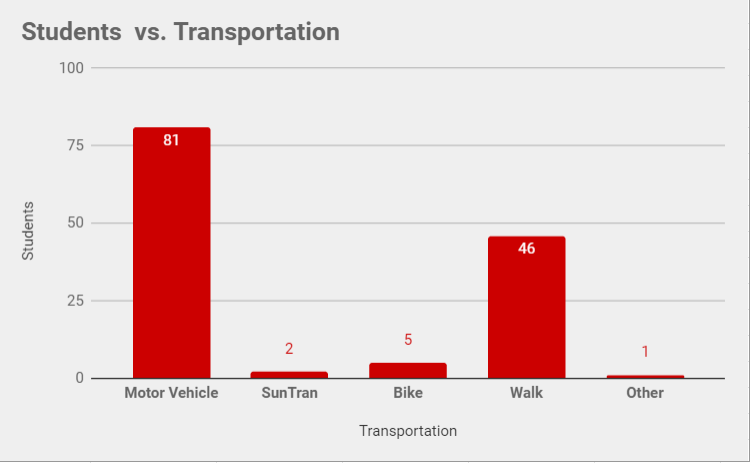
What the ISR team found out from the data gathered in the transportation category was quite surprising. The first thing we asked in the survey questionnaire is what kind of transportation DSU freshmen use to get around campus. The team found that a little over half the students, 81 out of the possible 123, used a motor vehicle to get to DSU each day, and another 52 students were walking, riding a bike, or using other types of transportation. We also learned that out of the students who had a motor vehicle, 53 had a job while 26 did not (one participant skipped the job question).
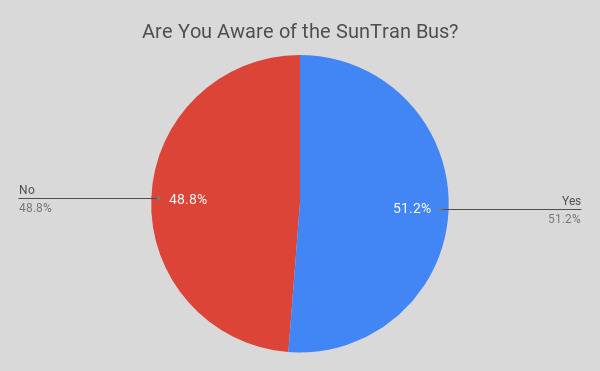
What we found interesting is that only 2 students out of the population we sampled took the SunTran bus. However, according to the survey, only 62 students said they knew about this student “freebie,” while 59 said they did not. In other words, 48% of the students weren’t aware that they could ride the SunTran bus for free.
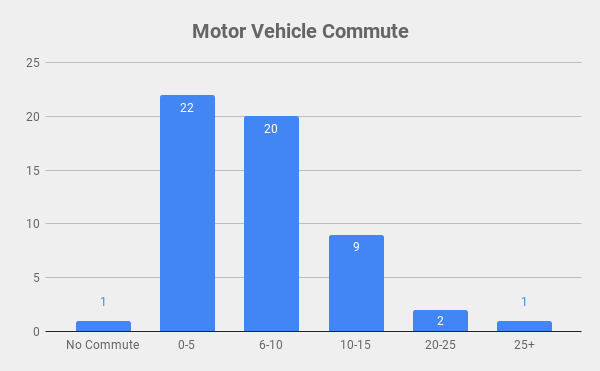
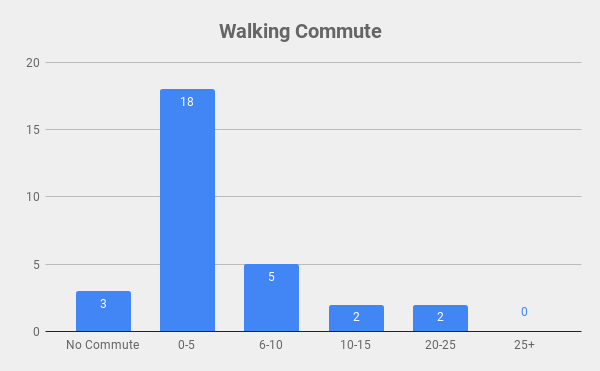
Another question the ISR team had was what the distance was to get to work for a student and what kind of transportation they used to get there. We found that the majority of students who owned a car and had a job traveled 0-10 miles to get to work. The team also found that many students who walked and had a job traveled 0-5 miles to get to work. Only 3 students had no commute.

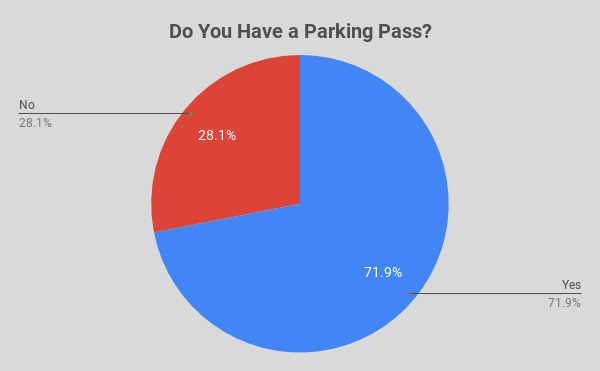
The next question was if students currently had a DSU parking pass of some kind. The survey results showed that 87 students had a pass while the other 34 did not. This proposes the question of why 87 students have a pass when only 81 of them drive a motor vehicle.
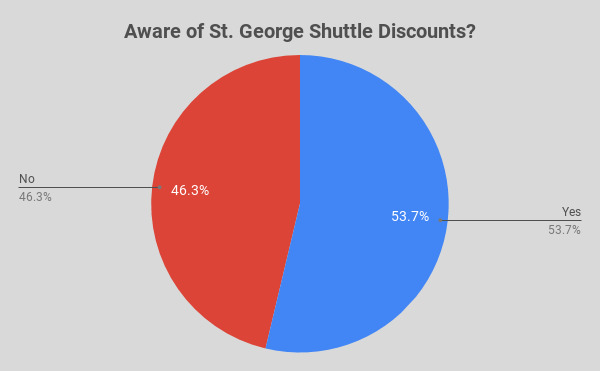
The next question was looking at the St. George Shuttle service. The first question about this asked if the students had ever taken the shuttle before. Out of the population we surveyed, 42 students said they had, while 79 students said they hadn’t. After this question, the survey asked the students if they were aware of the discounts they offered to students. The results showed that 65 students said they had and 56 said they hadn’t. Maybe if more students knew about the discounts offered, they might be willing to take the shuttle for various trips or vacations.
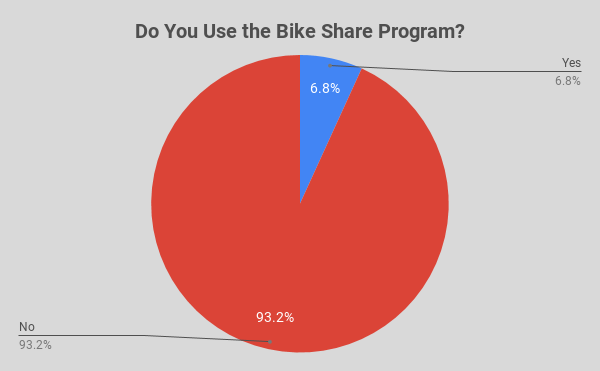
Next, the ISR team wanted to know if students were utilizing the Bike Share Program that St. George currently has. First, we asked if they knew about this program. Surprisingly, only 39 students knew about it, while the other 82 students hadn’t heard of it. Even more surprising, only 3 students out of the 39 (along with two other students who didn’t know about the program) used the bike program. This is something more students should be aware of at DSU.

The last question for this category asked students what they thought of current gas prices. For these freshmen, 31 students said it was expensive, 64 students said it was somewhat expensive, and 22 students thought it was not expensive. 3 students said they didn’t own a car. Using this data, the team did a cross tab of how many people had a job.
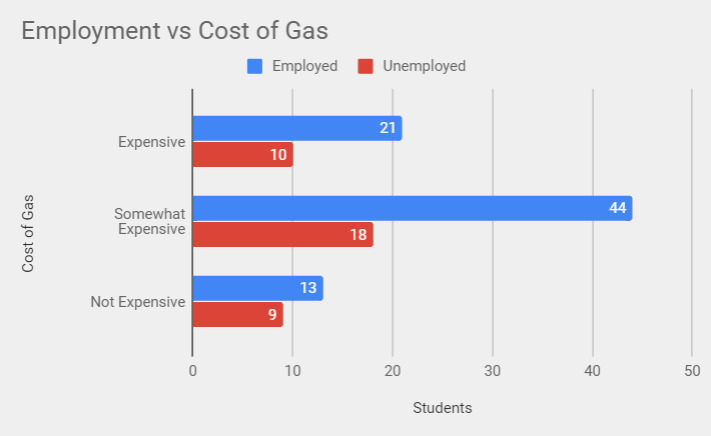
Does having a job influence whether students thought gas prices were expensive? The ISR team found that most people who had a job thought gas prices were either expensive or somewhat expensive. Only 13 out of the 80 students who had a job thought gas was not expensive.
Student Employment
INTRODUCTION
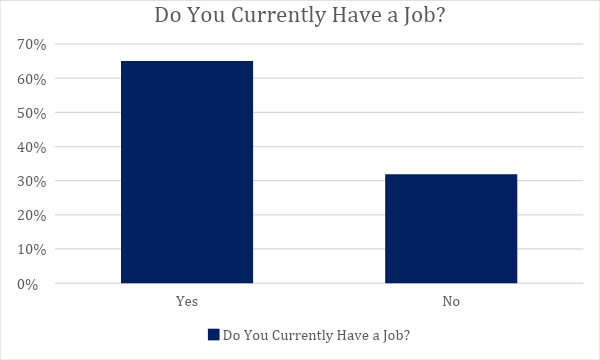
The Institute for Social Research team analyzed the cost of living for two hypothetical students attending Dixie State University. The purpose of this study was to show what our students’ quality of life is. Our proposition was that Dixie State’s students live a higher quality of life because we have lower tuition rates, which would alleviate financial stress on our students. This cost was broken down into sections. The sections analyzed here are student employment and off campus housing. The surveys that were completed show that many of our students are employed (65%). Although most of the surveyed students are employed, many seek financial aid of some kind (this can be seen in Figure 25), and many use a combination of different types of resources to get aid (parents, scholarships, loans, or grants).
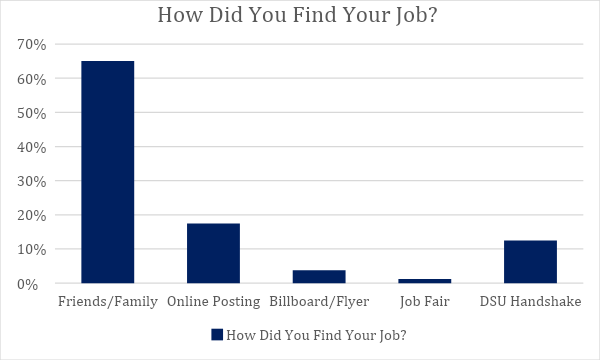
In fact, there are still some students who report that they feel stressed about paying for tuition. However, our sample had lower levels of worry than were expected. Jobs that were obtained by the students came from multiple sources, such as friends and family, online postings, billboards and flyers, job fairs, and the career and organization identifier department at DSU called Handshake. Most students work part time shifts (87.5%) while only 12.5% work full time. Also, 80.5T of the employed students work 30 hours or less. The employed students also have short commutes to work, with 78.1% of students having 10 miles or less for their round-trip commutes.
STUDENT EMPLOYMENT

In our case study, we surveyed 123 students. We were specifically targeting a freshman audience by implementing the survey instrument at introductory level sociology classes. Out of 123 students sampled, 80 answered that they currently had a job (see Figure 26). Along with asking if they had a job, we also asked how they got them. Looking at Figure 27, the options for students to make are stated. Many students with a job (65%) found it through friends or family. The second most used employment method was from online postings (17.5%, a dramatic decrease), and then followed by DSU Handshake (12.5%).


Lauren Perna (2010), who is a professor at the University of Pennsylvania that studies public and institutional policies that predict college access and success, states that “Working is now a fundamental responsibility for many undergraduates. But understanding how employment affects students’ educational experiences is complicated by why students work. Many students must work to pay the costs of attending college.” In fact, many students still worry about paying for tuition alone, even though it may be one of the lowest in the state of Utah (“Tuition,” 2018). In Figure 28, the students who have jobs and worry about paying for tuition amount to 61.2%. Meanwhile, those who do have a job and don’t worry about paying for tuition are at 73.5%. One could assume that these students have a mixture of financial aid, whether it be from parents, loans, scholarships, or grants.

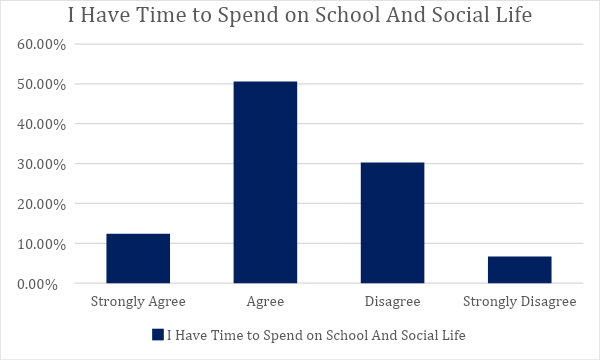
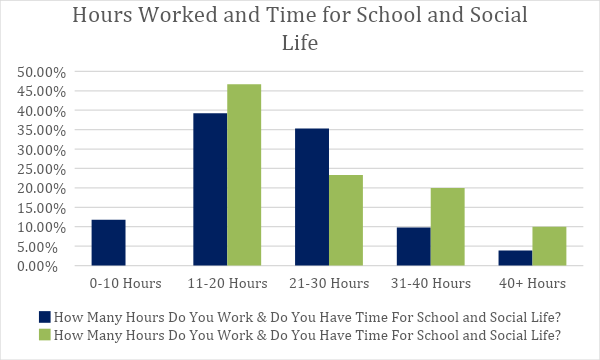
Perna (2010) continues later in her article by stating, “Regardless of the reason for working, trying to meet the multiple and sometimes conflicting simultaneous demands of the roles of student, employee, parent, and so on often creates high levels of stress and anxiety, making it less likely that students will complete their degrees.” Social life alone can be stressful for students to achieve. However, this was another question that we asked. In Figure 29, we can see that many students answered that they agree to having time to spend on school and social life (62.9%). Meanwhile, only 37.1% disagreed to having enough time.
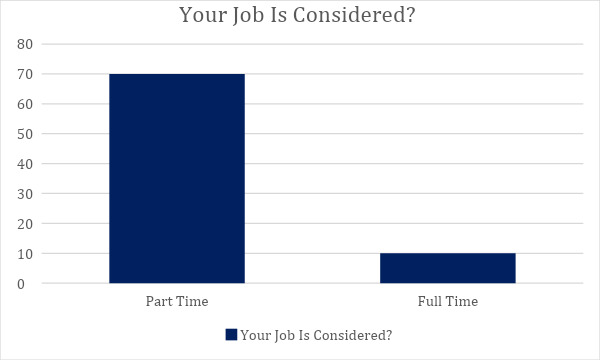
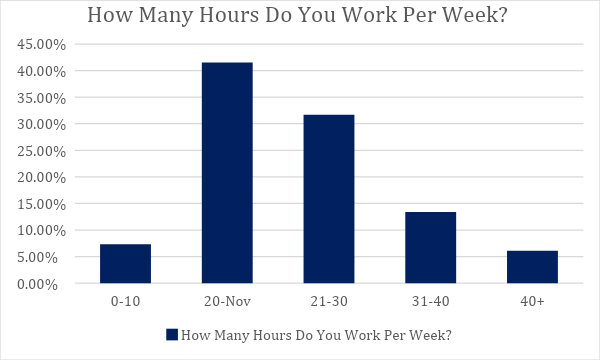
How often a student may be working in a standard week may also shed some light into their lives. If we look at Figure 30, we can see how many students answered that they work a full time (10) or part time job (70). If we continue to Figure 31, we can see how many hours that our students work in a typical week. Many students work between 11-20, and 21-30 hours a week. As you may have noticed between the two tables, there is a larger number of students who answered that they work full time than 40+ hours a week. The reason for pointing this out is because it is a typical requirement for an employee to work at least 40 hours a week in order to qualify for full time benefits. This suggests that the younger students we focused on do not know what full time employment requires. This could also suggest that employers may have led these students on into believing they work full time, but they aren’t.

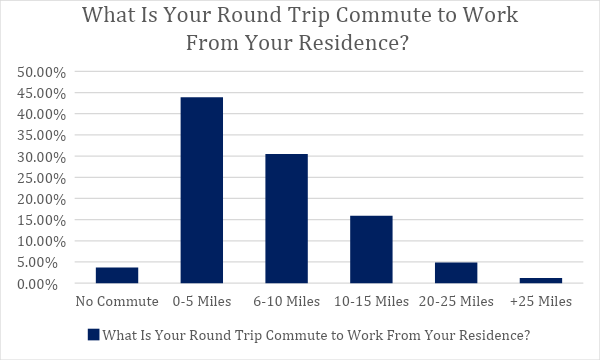
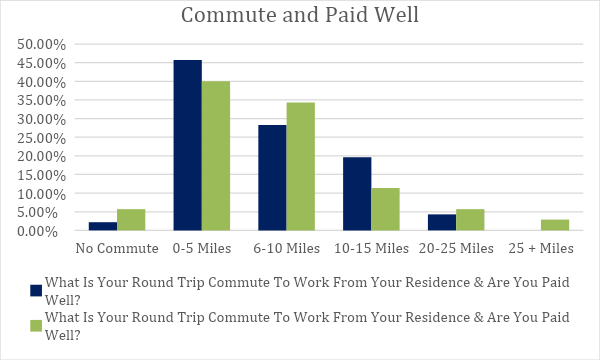
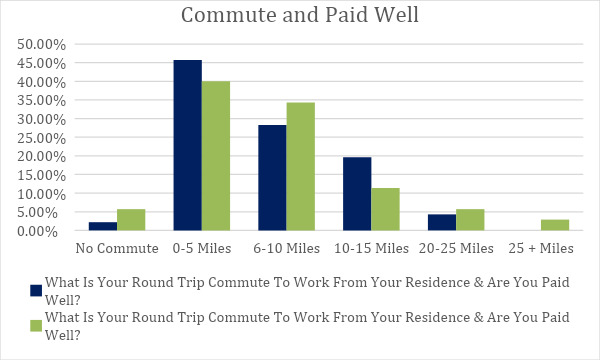
In Figure 32, we see the results for when we asked how far roundtrip the employed students travel for work from their residence. 78.1% of the surveyed students live under 10 miles away round trip (five miles each way). This could suggest that students are satisfied with the close employment options. This could also suggest that students either do not know about options further away or do not want to travel further away, regardless of pay (see Figure 33).


Money to pay tuition is the reason for a lot of student’s stress. Perna states that “One obvious approach is for colleges and universities to reduce students’ financial need to work by reducing the rate of tuition growth and increasing need-based grants” (2010). Dixie takes pride in its comparatively low tuition costs. According to Dixie’s website, “Full-time 2019-20 undergraduate resident students at Dixie State University paying a semester tuition and fee amount of $2,748 (before any financial aid, scholarships, or waivers) contribute an estimated 52% to the full cost of instruction per full-time student of $5,332 The remaining support for the full cost of instruction is provided by $2,584 of state tax funds” (“Tuition,” 2018).

Dixie may have relatively cheap tuition compared to the rest of the state or country, but do students rely on financial aid? If you look at Figure 34, you can see that 64.2% of students answered that they use financial aid. This includes scholarships, grants, or loans. Another good source for tuition help is a job that offers tuition reimbursement. However, there don’t seem to be that many job openings that offer it. If you look at Figure 33, 91.3% of students said that their jobs do not offer tuition reimbursement. These students are very likely in the medical field or similar areas that can afford this benefit.

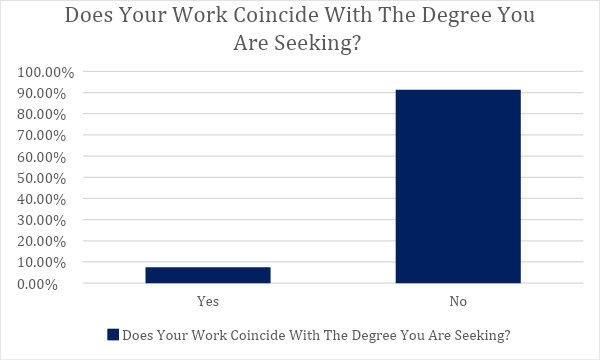
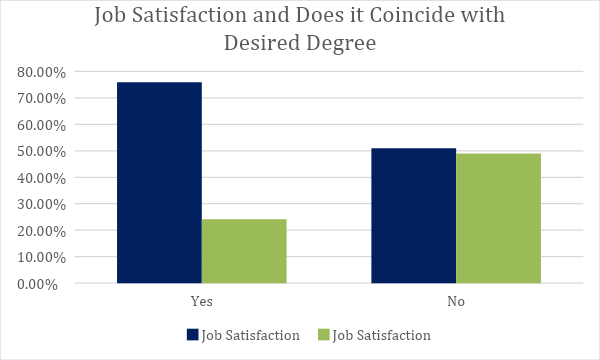
Another important question that we asked our sample of students was if their job coincides with the degree that they are pursuing. We must make allowances for our younger audience, for they may not know what degree they want to pursue, and they may just have a job to get them by for now. This simple idea could help to explain Figure 35. 91.3% of the students answered that their job was unrelated to their chosen degree. In the crosstab of Figure 36, we can see that the few who have a job in their chosen field are satisfied (75.9%), meanwhile those who are not in their desired field, are not (49%). There is also a small number of students who are in the field that they are seeking but are not satisfied (24.1%).

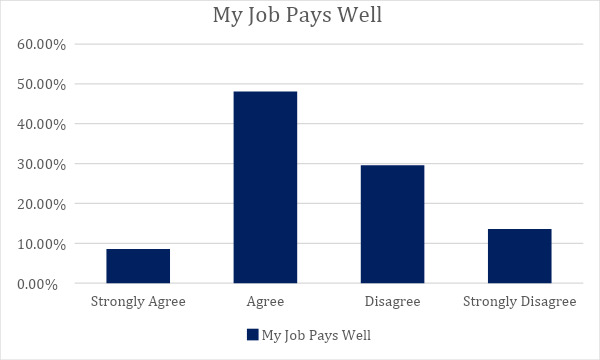
The main driving force to having a job is the monetary gain. But let us look at how a job and money can impact other aspects of our lives. In Figure 37, we can start by analyzing how people feel about their pay. The majority of the students answered that they were satisfied with their job (56.7%). However, it is only a few percentage points away from being even with the dissatisfied portion of our students. As we mentioned earlier, Figure 38 shows that students are not traveling very far for work. This could be for a multitude of reasons. It may be that they don’t have a car or that they do not want to travel for higher paying work.
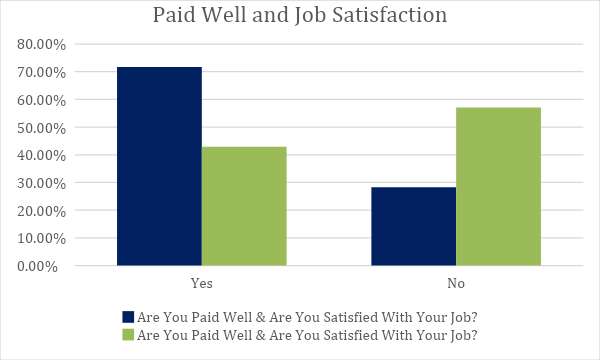
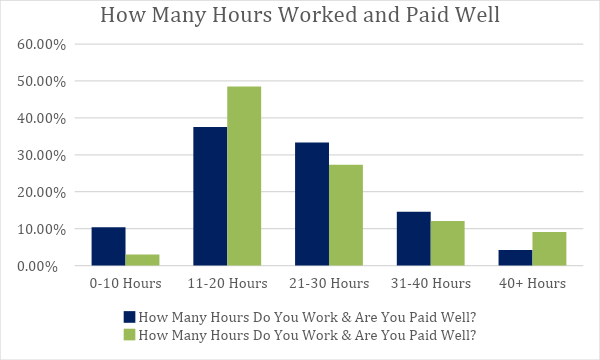
In Figure 39, we can see a crosstab between being paid well and job satisfaction. Those who consider themselves as being paid well have a higher job satisfaction rating verse those who are not (71.7%). However, those who do not think they are being paid well also have lower satisfaction ratings.


Payment can influence job satisfaction, but could having time for a social life also be a contributing factor to satisfaction? Moving on to Figure 40, the highest percentage can be found in the box that indicates that the students who do agree to have time for social life are dissatisfied with their job. This could indicate that they are willing to work less hours or take more time off for social events.

Figure 41 has some interesting numbers, especially considering how close they are to being even. At the 11-20 hours row, we see that there are more people who say they do not have time for a social life. However, the majority of those who work 21-30 hours a week answered that they did have time for a social life. This could be because the students who work more may also not be taking as many classes, or it could also be that they know how to manage their time more effectively. In Figure 42, there’s a crosstab to show the relationship between how long students work and if they are paid well. We can see that they highest percentage of students are being paid well and are in the medium range of hours. This could be that they do not need to work long hours because they are paid well, whereas the highest percentage of those who work the longest hours reported not being paid well.

Housing
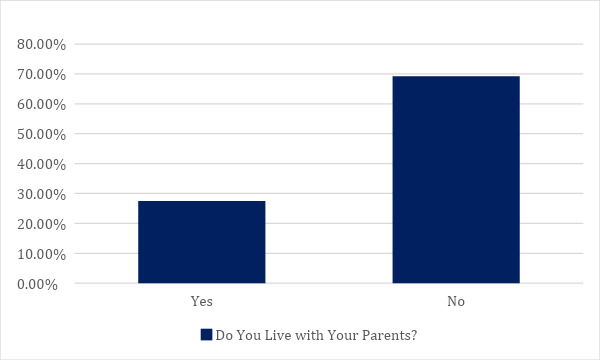
A basic question that we forgot to ask was if the student lived off campus. While we asked what their commute was and the average price of rent per month, we do not know for sure if the students are living on or off campus. There are a few questions, however, that can give us some insight. For example, the questsion “do you live with your parents?” Those who answered “no” to this question are more likely to be students who live on campus (see Figure 33). There were 83 students who answered that they did not live with their parents (69.2%).

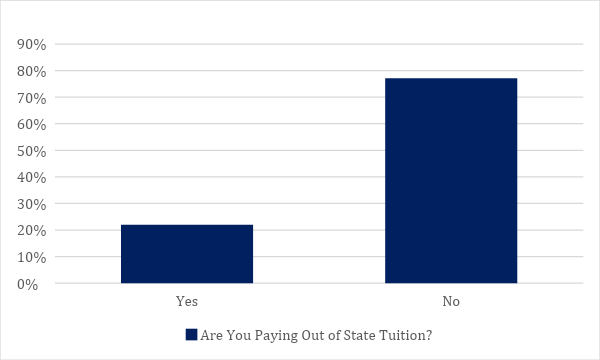
There was also the question of who was paying out of state tuition (see Figure 43). Students paying out of state tuition would likely live on campus due to a lack of familiarity their first year at Dixie. We came to a total of 26 students who paid out of state tuition (22%). Many students do live off campus: “Most students live off-campus — 87% — but even prospective students who plan to live in dorms can be affected by shaky statistics” (Sharp, 2016).
Some information that could be very important to consider is the rising prices for on campus dorms. “At a public four-year college, room and board costs on average $9,804 compared with the average in-state tuition of $9,139, the College Board data show. At the University of California-Berkeley, room and board is more than tuition, at about $14,000. This has pushed some students to move off campus in search of savings” (“At some colleges,” 2015). It seems that room and board has outpaced the prices of tuition at many schools.
A high (or seemingly low) dorm price can cause many different problems. First, it can push away potential students. The students may reconsider applying for the school or even move to a cheaper housing option which may not be the safest. Another problem with seemingly low prices is outlined by Sharpe: “While a low projection can be a boon for colleges looking to attract more applicants by seeming more affordable, it can spell disaster for students who enroll and then discover that their living costs are higher than they can afford” (2016).
A third problem is further outlined by Sharpe: “Perhaps most critical, the total cost of attending a particular college or university, as estimated by the institution, sets the upper limit on how much a family can take out in both federal and private student loans, leading some students to borrow more than they need and some to borrow less and run out of money” (2016). Overextending students could ultimately be hazardous to a student’s education.
ON CAMPUS HOUSING
The DSU student on campus housing selected for this case study was Campus View Suites. It is housing for single students with shared bedrooms at $1,699 per semester. Comparable on campus housing prices from SUU, USU, and U of U were researched. SUU’s Cedar Hall single student housing is $1,595 per semester. This housing is $104 less than that of DSU. USU did not have housing under $2,000; Blue Square Apartments at $2,070 per semester was the most cost effective for students wanting to live on campus. This housing is $371 more per semester than DSU. U of U’s Residence Hall and Officers Circle were $2,779 per semester; of the four colleges, it is the most expensive housing, costing $1,080 more per semester than DSU.
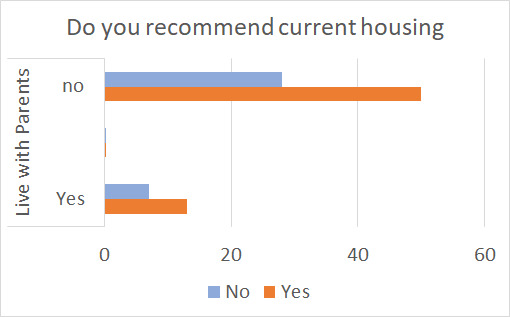
Through the survey students, were asked if they lived with their parents. It was assumed that students who didn’t live with parents lived on campus. Our survey had two questions pertaining to student housing satisfaction: “Do you live with your parents?” and “Would you recommend your current housing to incoming freshmen?” 50% of the respondents not living with their parents recommended student housing. This indicated that students not living with parents thought campus housing was adequate for their needs and recommended housing to other students.
Conclusion
In conclusion, the freshman orientated sample that we chose are mostly employed. Many of the employed students do not travel far for work; 78.1% have a 10 mile or less round-trip commute to work from their residence. Although over 90% of students reported that their job doesn’t coincide with their degree, 46.9% do find their jobs satisfying.
For those only beginning in higher education, most students responded that they felt that their job pays well (56.7%). Those in school and still working still manage to make time for a social life. 63% of employed students agreed that they find time to be social.
The students working to pay for their education are also not offered jobs that help pay for tuition. 91.3% of students responded that their employees do not offer tuition reimbursement.
Off and on campus housing can be tricky to maneuver around; the only way to know who off campus was to guess. However, in the future, we will be asking more direct questions in order to understand more precisely where our students are.
Many students reported using a backpack and a laptop for their classes and using the DSU print system to print off items needed for classes. As of April 30, 2019, the price of the print system has doubled from 5 cents per page to 10 cents per page. The cost of food in St. George is the third cheapest in this study. There is only a 1.6% difference between St. George and Logan, the runner up for low cost food. With the competitive price of food in St. George, students can still maintain a good quality of life while living and going to school at DSU. Almost all the respondents reported using a grocery store to obtain food. The lowest cost of grocery stores in the area is Walmart.
From the data the ISR team gathered, many students have a motor vehicle they use to get to and from school each day. If they don’t have a vehicle, many students will walk. This isn’t surprising because many students who walk and have a job only must travel 0-5 miles. There were a few (about 9) who had to travel further to get to their job, but walked anyway. However, many students put more than one answer to what kind of transportation they used. That said, many could have a car or use some other type of transportation if they had to travel a long way to their job.
What is interesting is that only 2 students took the SunTran bus and 59 students didn’t know they could ride it for free. If more students were aware of this, it would allow them to take the bus more frequently and save money. This could also be applied for the Bike Share Program that St. George offers. Lastly, the overall outcome for current gas prices was that the students thought gas was either somewhat expensive or expensive. This result was based on whether the student had a job or owned a motor vehicle. The ISR team learned many things about how and what students use to get to school or around St. George. As a result, this information will be helpful to many people, especially those who are thinking about going to school at Dixie State University.
Author Biographies
Emma Angell
Undergraduate Senior in Applied Sociology
St. George, Utah 84770
Emma Angell is a senior at Dixie State University (DSU) and will graduate Spring 2020 with her Bachelor’s in Applied Sociology and a minor in Non-Profit Organizations. At Dixie, she has served on three research teams for the Institute of Social Research. Her first research semester was focused on freshman students at DSU and their quality of life. Her research regarding the Freshman’s quality of life has been published and presented at DSU Research Symposium, Spring 2019. The team’s research will be presented at The Pacific Sociological Association, March 2020. Emma is also a member of Alpha Kappa Delta, the International Sociology Honors Society.
Kamrie Davenport
Graduate in Applied Sociology
St. George, Utah 84770
Kamrie Davenport attended Dixie State University (DSU) for a Bachelor’s in Human Communication in 2017. Upon graduating, she returned to DSU for a second Bachelor’s in Applied Sociology, which included a certificate in Social Research Methods in 2019. When she is not researching, she is hiking in the mountains, biking on local trails, kayaking at the lake, or quilting a new blanket. She has enjoyed growing up in St. George because it has put her in an excellent location near many national parks such as Lake Powell, Bryce Canyon, Zion, and the Grand Canyon. Kamrie is currently working on her Master’s degree in Sociology at Arizona State University.
Edward L. Hager
Bachelor’s Degree in Applied Sociology
Salt Lake City, Utah 84116
After 20 years of military service, Edward Hager retired in May 2016. After his military retirement, he returned to school at Dixie State University to obtain his Bachelor’s degree in Applied Sociology. While working towards this degree, he received his certification in Social Research. Upon receiving his Bachelor’s degree, Edward moved from St. George to Salt Lake City and began working for the Department of Veterans Affairs at the Salt Lake City, Utah VA Hospital. At the same time, Edward began working on his Master’s Degree for Marriage and Family Therapy (MFT) through Northcentral University.
Dustin Mattei
Undergraduate Senior in Applied Sociology
Dixie State University, St. George Utah
Dustin was one of the first members of the Applied Sociology program. The Institute for Social Research (ISR) was founded in 2018 and Dustin was on the first team that launched the Quality of Life Initiative. He became a member of the Pacific Sociological Conference where he would present Social Capital in a Virtual World in Oakland, California. He would present his project at the Spring 2019 Dixie Symposium with the ISR’s results, defining the quality of life for a single mother with two children and that of college freshman at DSU. In Fall 2019, he was promoted to research coordinator for the ISR. He was inducted into Alpha Kappa Delta in Spring 2020.
Sandra Taylor
Bachelor’s Degree in Applied Sociology
Saint George, Utah 84770
Sandra Taylor is honored to be part of the Institute for Social Research (ISR) team at Dixie State University (DSU). She has an Associate’s of Science, a Bachelor’s of Science in Applied Sociology, and is currently pursuing a Master’s degree. After receiving her Bachelor’s, she accepted a job as a Licensed Practical Nurse (LPN)/Case Manager at a local community healthcare clinic. As a member of the ISR team, she spent countless hours with her peers researching their projects and working closely to present their findings. Now, on a daily basis, she applies the knowledge and skills learned at Dixie State University to empower individuals and families to thrive in every aspect of their lives.
Savanah Truman
Undergraduate in Applied Sociology
Saint George, Utah 84725
After graduating high school in Enterprise, Utah, Savanah went to Dixie State University in Saint George, Utah. There, she assisted in the Institute for Social Research program for three semesters. These efforts allowed her to become a co-publisher in the “Quality of Life Initiative” publication from Spring 2019. In addition, Savanah will become a co-publisher of volume two in the “Quality of Life Initiative” for Fall 2019 and Spring 2020. Savanah has also started and maintained the social media platforms in the Applied Sociology department for the last year and is a member of the Applied Sociology Club.
Appendix